10 June 2021
How to debug a Node.js application in Visual Studio Code: TypeScript debugging (2/3)


Javascript and Typescript debugging may seem like similar processes but in order to do them right, you need to know how to handle the differences. In the second part of my Node.js app debugging series, I’ll focus on debugging Typescript code with Visual Studio Code.
Typescript debugging for static typing fans
Sooner or later you will create a bug while writing the code. You will be aware of its existence only after Quality Assurance walks into the project and find the nasty thing, or integration tests inform you about it.
In the first part of my “How to debug a Node.js application in Visual Studio Code” series about JavaScript debugging, you’ve learnt that Visual Studio Code provides you with a lot of features that allow you to quickly locating and fixing bugs.
When you want to debug a project written in JavaScript, you just need to modify the default configuration file launch.json a bit and you can start your bug hunt.

However, if you are a fan of static typing and your project is written in TypeScript (❤️), you will need to put a little more work into the debugging process. Don’t worry though, today I’ll show you what you need for a great Visual Studio Code TypeScript debugging.
Here you can find the project that we will check together for errors. Or rather, only one error…
To be able to run this project in your local environment, you need the following things:
- Application code downloaded from Github,
- Node.js (at least 12.0.0 version) installed,
- Docker 20.10.6 version installed (at least this is what I’m currently using).
About debugging TypeScript app project
This time, there is no client side code. My project is a simple API written in TypeScript using the Express.js framework with the Postgres database using TypeORM. All used libraries can be found in the package.json file.
Wondering what the reflect-metadata library does in this file? You’ll need it for the correct operation of decorators used in models with TypeORM. The API aims to provide a simple CRUD to handle books and save them in the database.
The API from the first part of the series was written in JavaScript, so when you launched the debugger, you went through the code we wrote. Here the situation changes because the code is written in TypeScript which is converted to JavaScript. The converted code loses its readability and it would be difficult to check it for errors, so I bet you prefer to check the Typescript code. One of the properties of the tsconfig.json file comes to our aid:
Thanks to the sourceMap: true property,TypeScript will generate source maps files (.js.map) with which the debugger will map the code in JavaScript to the code in TypeScript.
Typescript project’s structure
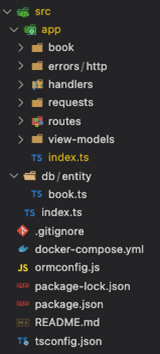
Above, you can see a simple project structure and a brief description of the major directories:
- app – application code written in Express.js,
- db – database entity code written in TypeORM,
- docker-compose.yml – configuration file for quick database startup in a container,
- ormconfig.js – configuration file needed to establish a connection between TypeORM and the database.
How to launch the Typescript project?
Step 1: Download the project locally
Step 2: After entering the project’s directory, install the API dependencies
Step 3: The API saves information in the database, so before running the API you also need to run the database:
Step 4: Run the application with the npm script:
After completing the last step, you should get the answer from the API here: http://localhost:3000/books
At the moment, your database is empty and the API doesn’t return anything. Let’s add one book to check if everything works properly. To add a new book, you need to make a request to the API:
Response from API should look like this:
By entering the following address in the browser: http://localhost:3000/books you should see all books. Alternatively, you can make a GET request with your favourite HTTP client to the same address and get a response with all books in the database.
If you’ve added several books and wanted to display them all, you’ve probably noticed by now that you always get only one book object in response.

I think it’s time to run the debugger and check the code.
Let the Typescript debugging commence!
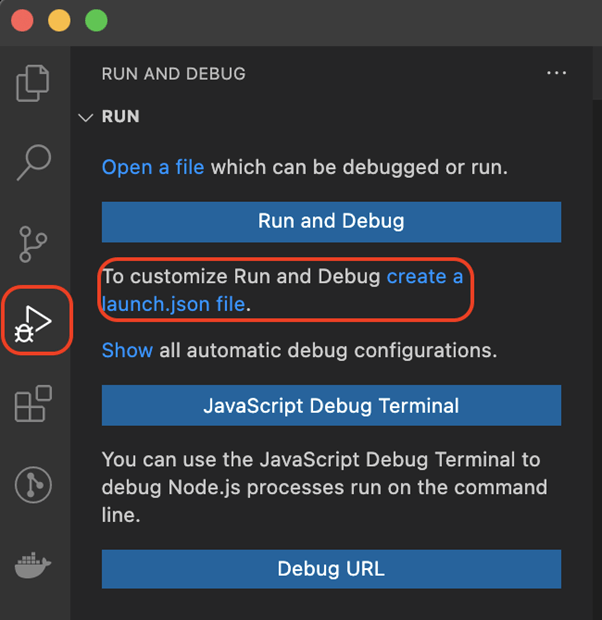
Same as in the previous post, first you need to add a project configuration file. On its basis, the debugger will be run:
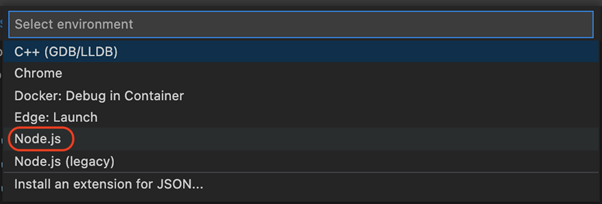
After selecting the environment, a launch.json file should be created with the default settings:
Unfortunately, the default settings are not enough to debug TypeScript code, so you need to add a few additional launch configuration settings:
Most of these properties were discussed in the previous article, so I won’t detail them again here. I will just describe the new properties:
- outFiles – a value that specifies the path pattern where the files with the extension
.jswill be placed so that the debugger can associate them with the mapping files with the extension.js.map. - resolveSourceMapLocations – a value that specifies in which directories the debugger can use the mapping files. In this example, we’ve blocked them from being used in node_modules to make mapping faster.
- preLaunchTask – a value that specifies tasks that must be performed before a debugging session. As you know, TypeScript files must be converted into JavaScript code (one task). The API uses a database, so the next task will be to run the database.
- postDebugTask – a value that specifies tasks that must be performed after a debugging session. In our case, it will be deleting the generated files with JavaScript code and closing the database.
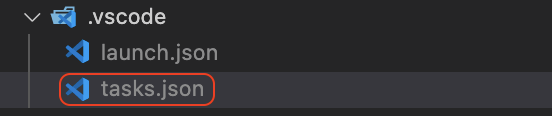
Where are the tasks that should be performed before and after the debugging session?
In the location of the launch.json file, you need to add a new file (tasks.json), in which the above-mentioned tasks will be included.
Place the task configuration in this newly created file:
As you can see, the file with tasks is not complicated. You can set the type of the task, whether it will be an npm script or a shell. It is very helpful to create tasks consisting of several interdependent subtasks. In this case:
- prepare the app to debug,
- clean app after debugging.
Now that everything is set up, it’s time to check where the bug is hiding in the API.
In the previous article, I covered how to navigate the code while debugging, so if you haven't read it yet, now's a good time to catch up.
Visual Studio Code and spotting bugs in API
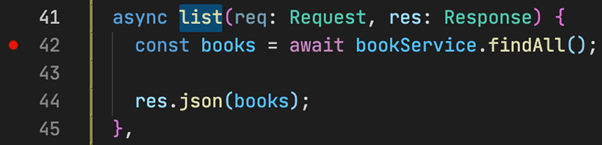
The problem appears in the code related to listing all books, so you should start searching in the controller function book-controller.ts responsible for returning all the books. So let’s put the breakpoint on the list function in the 42nd line of the controller’s code.
After setting the breakpoint, you can start the debugger and trace the execution of the code.
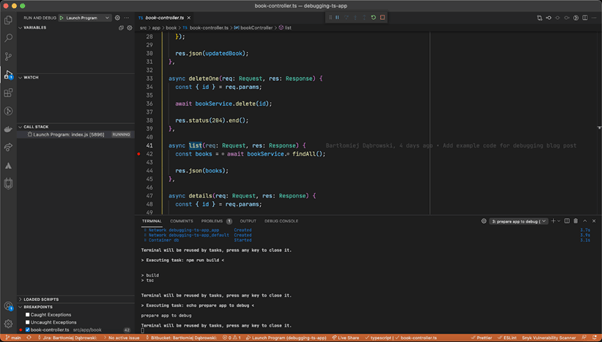
In Visual Studio Code go to the Run and Debug view (Cmd ⌘ Shift ⇧ D) and click the green arrow next to Launch Program.
After starting the debugger, you should have this view:
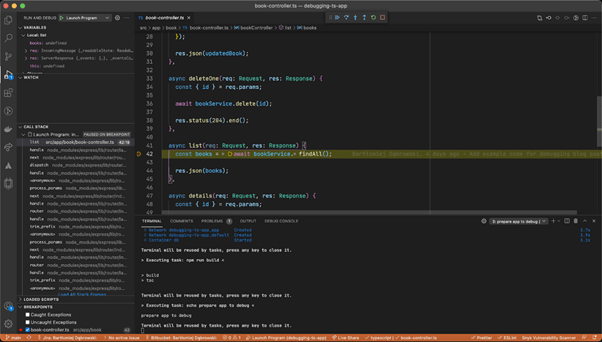
Now you can go to this address in the browser: http://localhost:3000/books and then you will be transferred to the debugging session.
After entering deeper into the service function called by the controller, you can see where the error is hiding:
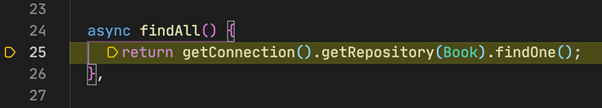
Instead of looking for all the books, I use the wrong method and return the first book I find.
Fortunately, this bug is quick to fix, just change the function
findOne()tofind()and the bug has been fixed.

Visual Studio Code: TypeScript debugging – summary
Hope I convinced you to use the debugger when looking for errors in your code. Of course, there is nothing like the good old console.log ("YOU ARE HERE !!!!!") and its debug mode, but sometimes you just need to analyse the flow of our code more thoroughly and then the debugger will come to your rescue!
The third (and the last) part of my series covers the debugging integration tests in Jest.
Fan of Typescript? So are we! While you wait for the last part, read other clever tutorials from my colleagues:

