01 December 2020
How to debug a Node.js application in Visual Studio Code: JavaScript debugging (1/3)

Debugging is one of the most critical aspects of software development. As you probably know, JavaScript programmers really do have their task cut out for them due to the nature of this language. But at the same time, it’s not something that can’t be made much easier with some good tools. Let’s see how you can debug Node, make some Node.js debugging with VS Code and make your life much easier in the process.
One of the main tasks of the programmer is finding and correcting errors in their code. This is called debugging. The more you code, the more likely it is that you’re going to have some debugging to do. It’s only natural and not a cause for share or concern. After all:
It’s only those who do nothing that make no mistakes – Nikola Tesla
Debugging is all about finding the cause of the error quickly and eliminating it. Unfortunately, in the world of JavaScript, this activity is almost inseparably tied to the function console.log().
It’s worth knowing that our integrated development environment (IDE) of choice is equipped with a variety of tools that can speed up and simplify debugging.
In this article, I’m going to go over the most helpful features of Visual Studio Code (VS Code) that you can use to debug Node, more specifically to debug the code of a simple API written with Node.js based on vanilla JavaScript. As Node.js is getting more and more new features and finds new uses, the issue of Node.js debugging will become even bigger.
And VS Code has plenty of tools to debug Node, including VS Code code debugger, launch configuration options, the ability to set breakpoints, support for the external terminal as well as integrated terminal, VS Code Node inspect tools. VS Code can really make or break your application running Node in terms of debugging. If you are as much of VS Code fan as I am, you will definitely appreciate this!
So let’s get right to it!
Node.js Debugging with VS Code – basics
Our example application is written in vanilla JavaScript running Node js. It’s a simple CRUD app. It was important for me that the app was divided into a couple of files and modules and so that the API logic was not contained in a single index.js file. You can download the source code here. Once you get it and enter the project directory, you can start the launch program:
1. Install all the dependencies:
2. Launch the project:
When the VS Code project is launched, you can make sure it works fine by making a request to the newly launched API from the terminal:
1. Adding a new book:
2. Getting information about a book:
3. Getting information about all the books:
4. Removing a book:
Does everything work? Let’s kill the process then and get to debugging.
We’re going to do some debug configuration for our Node application. The debug configuration involves a couple of steps.
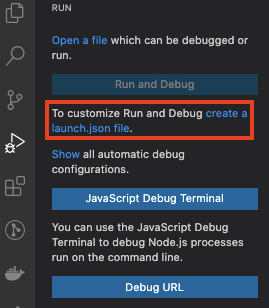
Start by opening the debugging side menu in VS Code (Cmd+Shift+D or Ctrl+Shift+D) and add a launch.json config file, which includes all the configuration of debugging parameters.
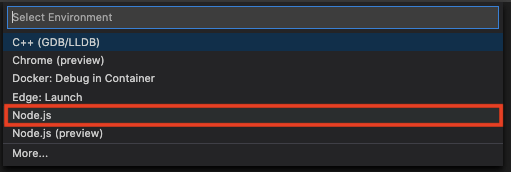
Then, choose a debugging environment. In this case, it’s going to be Node.js.
When you pick the environment, the .vscode directory (which includes the config file) is automatically added to the project structure:
Even if you tend to mostly use console.log for debugging and don’t use the debugging view much, you shouldn’t have a problem with understanding the various properties of the debug configuration. Let’s go over them briefly:
Type
A debugger type you want to use in a particular code launch configuration. In this example, it’s Node. With VS Code, you can debug code written in Python, Go, PHP and many other languages supported by the IDE.
Request
The code launch type for this launch configuration is launch, which means that the code is to be launched from scratch. The attach option would allow you to connect with a code that is already launched.
Name
The name of the launch configuration in launch.json. When you have more than one debugging launch configuration, it makes finding a specific one easier.
SkipFiles
A path to files to be excluded from the debugging process.
Program
An executable file or file to be launched concurrently with the debugger. The default configuration launches an active file currently opened in VS Code.
After a couple of changes to launch.json, the launch configuration is now as follows:
When you add the launch.json file, the sidebar with debugging view changes. It now includes:
- a button that launches the debugging process,
- configuration list,
- variable view,
- watch view,
- call stack view,
- active scripts view,
- breakpoint view.
I’m going to talk a little about them later.
It’s time you run the code in the debug mode. Click the green arrow next to the configuration of choice or use the shortcut fn+F5 or F5.
There are two changes that you should be able to notice from the get-go:
- The bottom bar of the VS Code has now changed color from blue to orange, which signifies the debug mode.
- In the upper part of the debug mode interface, you should see a new menu:

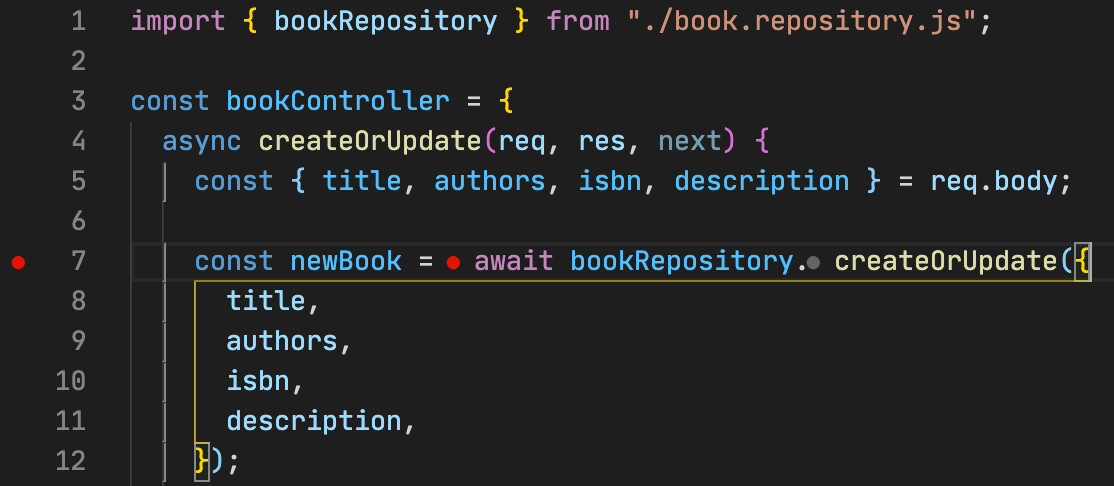
You’re going to use the menu of the debug mode to navigate the code in the debugger. Before you begin, add your first breakpoint and check if the process ends at the place you put it. Open the book.controller.js file, hover over line 7 and click to the left next to it. When a red dot appears, you have just placed your breakpoint.
You can use the debug mode to make a test request to the API to check if the breakpoint works properly. Let’s use the terminal for that and add some command line. The command is:
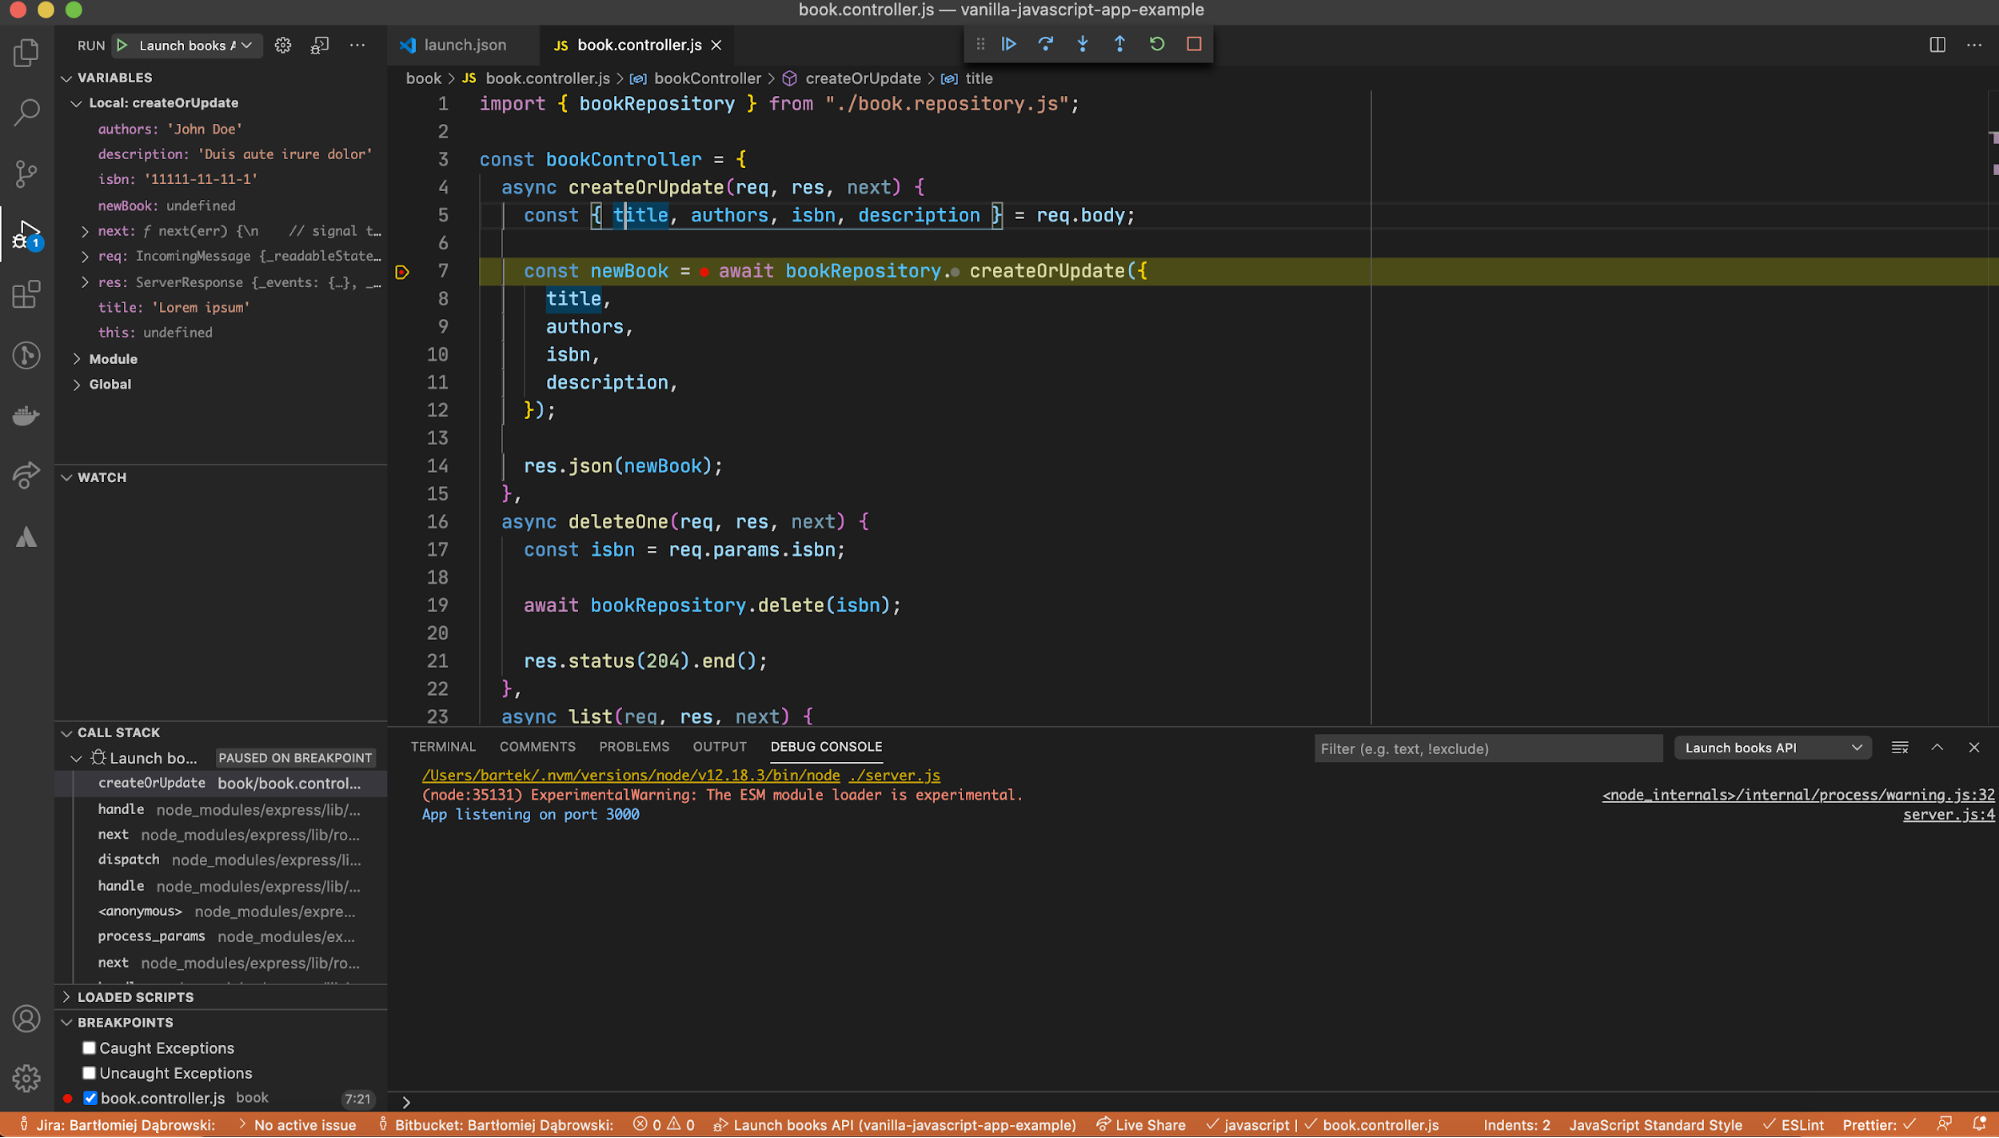
The process predictably stopped at the breakpoint. The IDE view now should look like this:
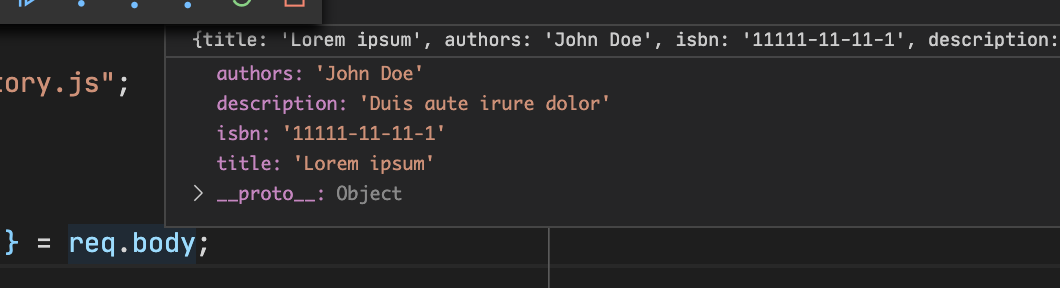
When you now hover over req.body, you can see what’s inside the body or in the whole request object.
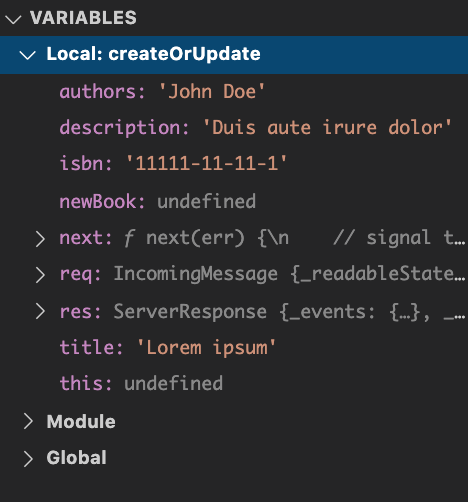
In the VARIABLES view, you can see all the local variables of a given function. You can also access variables from the module as well as global variables:
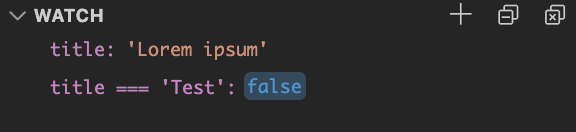
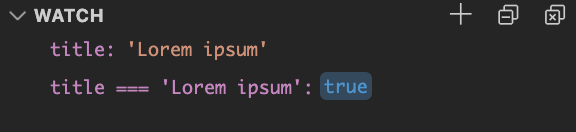
The WATCH view is empty because nothing is added to it yet. It’s useful when you want to watch one or a few specific variables when you execute the code. It shows their state at all times. Let’s add the title variable there just to test it out. Hover over the WATCH view and click the plus symbol (Add Expression). The WATCH view allows expressions as well.
The CALL STACK view contains information about functions that were called on the way to the breakpoint. The Restart frame is a useful feature that appears when you hover over the execution panel of any function.
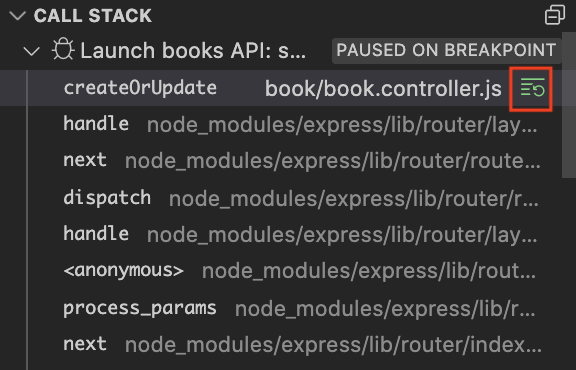
When you click the green button, you can return to the beginning of the function stack. You can call a function again with different variables specified in the VARIABLES view. Learn more about this view.
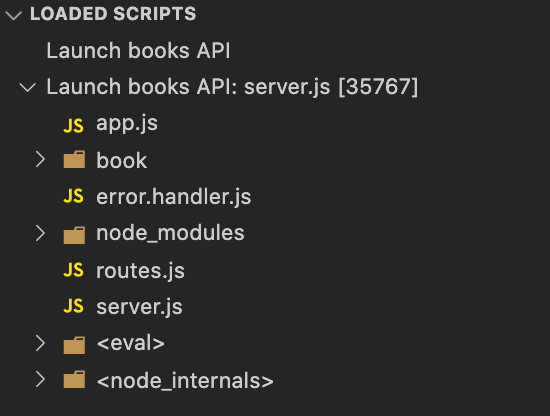
The LOADED SCRIPTS view makes it possible to navigate the scripts currently loaded so that you can create new breakpoints. Find out more about the LOADED SCRIPTS view here.
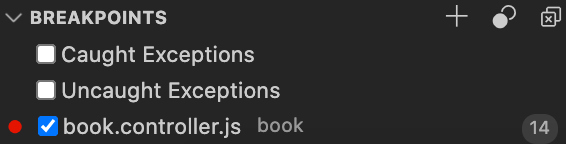
The BREAKPOINTS view contains information about all breakpoints in the code. After you set a breakpoint, you can activate, deactivate and remove any of your breakpoints. You can also modify the conditions for your breakpoints (more on that later).
💡 Fast and good? Wasn't easy but we've managed
Navigating the code
What are next steps? While debugging with VS Code, it’s vital to navigate the code in the debugger efficiently. You can do it with the upper debugging menu or keyboard shortcuts. Enter the menu and click the green arrow to launch the project. Below you can see the name launch as part of the name launch program:

When the bottom bar of the IDE turns orange, open book.controller.js and set a breakpoint at line 5.
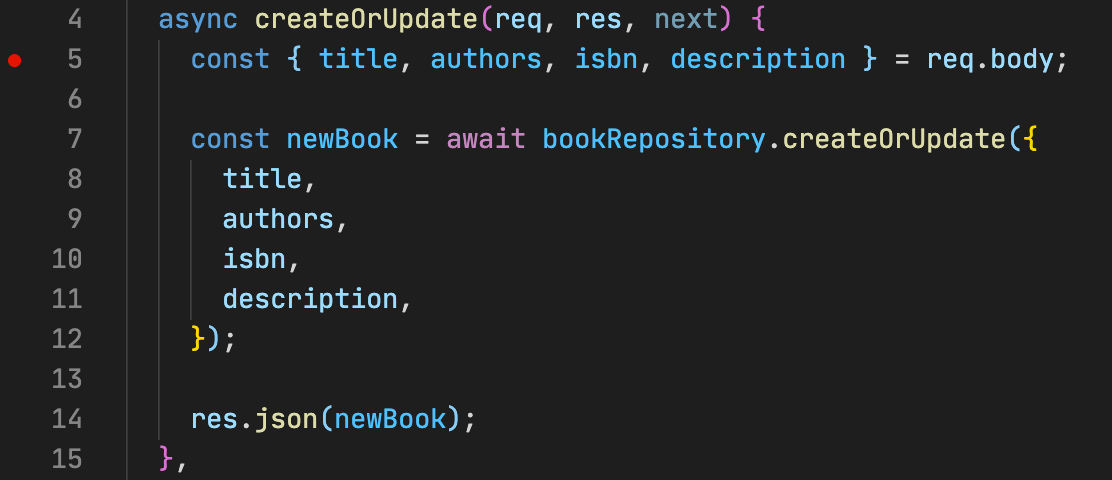
Now you can send a request to the API:
The process has predictably stopped at line 5. You can navigate the function to find out what exactly is happening there. There are a couple of buttons you are going to need for that. Let’s take a closer look at them:
1. Continue (abbr.: F5)
![]()
Use this button to skip to jump breakpoint, bypassing the code between two breakpoints (the code will be executed but there will be no need for any action from you).
2. Step Over (abbr.: F10)
![]()
Use this one to analyze the code line by line throughout the entire execution of the function.
3. Step Into (abbr.: F11)
![]()
As you analyze the function line by line, you may want to take a closer look at a function that returns a particular variable or saves something in the database. You can do it with Step Into. For example, you can access the createOrUpdate function implemented in bookRepository.
4. Step out (abbr.: ⇧F11)
![]()
A counterpart of the Step Into feature. If you enter a function, you may wish to escape it before it is executed completely. You can also use it to abort the execution of the function definitely and return to the main codebase.
5. Restart (abbr.: ⇧⌘F5)
![]()
Use it to reset debugger. Let’s say you are looking for a bug in the code but can’t find it. With Restart, instead of killing the debugger process and relaunching it from the start, you can quickly reset it at the click of a button.
6. Stop (skrót: ⇧F5)
![]()
Use it to stop debugging at any moment.
💡 Looking for a job in Node development? Prepare yourself first!
Conditional Node js debugging with VS Code
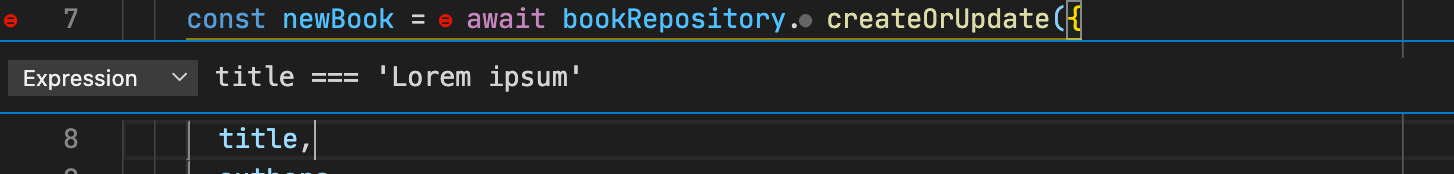
Let’s say you don’t want to check every single execution of a given function but only those that meet certain criteria. Let’s try to break the process when the title of a book is Lorem Ipsum.
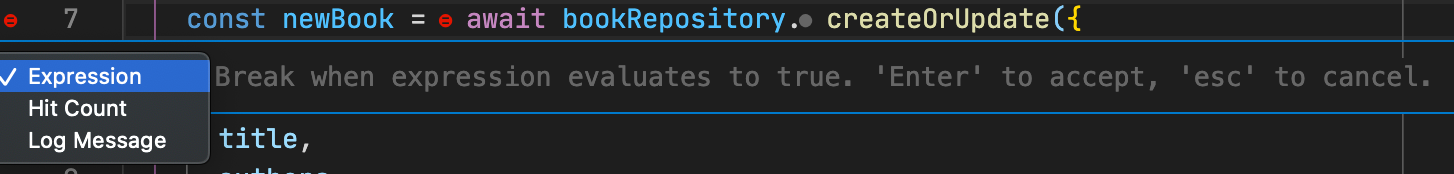
You can do it by adding this condition to your breakpoint. Use the BRconfEAKPOINT window in the side menu of the debugger or directly in the line where you set the breakpoint. Right-click it and choose Edit Breakpoint. You’re now going to be able to add your condition. It may concern a specific expression or the number of hits (hit count) for a given breakpoint.
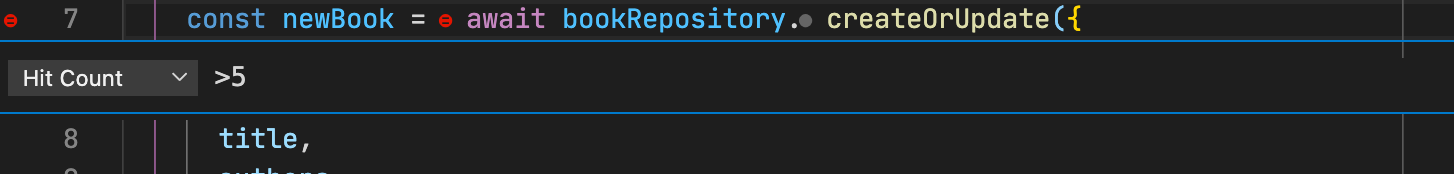
For Hit Count, you can use the following expressions:
- > 10 break after 10 hits
- < 3 break on the first two hits
- 10 same as >= 10
- % 2 break on every other hit
How to debug Node js application in Visual Studio Code – summary
As you can see, VS Code has a lot of useful features that go a long way to answer the question of how to debug Node js application in Visual Studio Code. It’s true that console.log may be faster if you want to check out something quickly, but the more complex your code, the more troublesome this approach becomes. VS Code can definitely help you get better control of your code.
And if you still wonder if debugging is really worth the effort to do this, think of it this way: if you “debugged” this article properly from the start, you would have known that the piece of wisdom I quoted at the beginning was actually said by Joseph Conrad, not Nikola Tesla. 🤭
That wraps it up for debugging Node js in the form of vanilla JavaScript in VS Code. But do not fret, TypeScript fans, we’re going to take a look at debugging Node js TypeScript code with Visual Studio Code in the next instalment of this Visual Studio Code series. We’re also going to talk about many aspects of VS Code that were skipped in this article. We’re going to go deeper into debug configuration, source code and various details of the launch program so you can debug your Node js application even better.
Read the next part here:
We have a newsletter for awesome content just like that! 📧
If you want to receive more useful Node.js tutorials like this one, check out Techkeeper’s Guide. It’s a selection of tutorials, tips and tricks hand-picked by our developers. Check out the latest issue and see for yourself.

