12 November 2020
Metrics in optimization process: collecting data with Prometheus (3/4)


The metrics in optimization process series covers the most important aspects of configuring your application so that you can collect and analyze important app performance data. In the third part of the series, we’re going to do some DevOps work and learn even more about Prometheus.
Metrics are a great way to manage how an application works. Thanks to them, developers are able to:
- improve efficiency,
- reduce costs,
- and sleep soundly without having to worry about unexpected and unpredicted behaviors.
In the first part, we found application bottlenecks. Then, we created a basic application setup to start getting data. Now it’s high time we did some DevOps work to configure the Prometheus server and database in order to collect data for monitoring.
Before we created the Prometheus instance, we decided to check the whole infrastructure and define what we really needed and how to collect everything in the best way. To achieve this goal, developers and DevOps needed to work closely together. Finally, we prepared a list of requirements:
- one storage for various metric sources (Symfony application, nginx, pods etc),
- only one database instance,
- many PHP pods which were scaled dynamically,
- one instance to handle everything,
- one source to show all metrics (Grafana).
Prometheus data collection – how to start?
When we know the infrastructure, we can focus on the data collection issue. In order to test anything, we need to have an application with some traffic. We’re going to do this with an application we built for the purpose of this series.
To create traffic, we can ask specific endpoints to initialize data manually – a rather daunting task. Besides, it will not create interesting data that shows how the application works before and after optimization. It will be hard to show nice before-after optimization reports to business.
There is one tool which we can use to generate data – Artillery. With this simple configuration, we can generate some traffic:
Feel free to experiment with the phases.json file to create interesting scenarios. Be careful to not kill your PC when you set too many tests. It’s better to do it in an iterative manner to understand the limits of your machine.
Prometheus operator
Ok, time for some DevOps work here!
The application infrastructure is built with Kubernetes (k8s) – an open-source system for automating deployment, scaling, and management of containerized applications.
Our example is based on a local Kubernetes (k8s) installation provided by kind (Kubernetes in Docker). It’s great for running local Kubernetes clusters in Docker containers. It saves a lot of time and the configuration does not trash our environment.
With Kubernetes, we don’t need to configure everything from scratch. To automate the process we can use the Prometheus Operator.
The Prometheus Operator provides the following features which we are going to use:
- managing Prometheus instances for Kubernetes, an application or team,
- monitoring target configurations based on the familiar Kubernetes label queries,
- configuration for the fundamentals of Prometheus such as versions, retention policies, persistence, and replicas from Kubernetes,
- independent of the implemented languages in the application.
To simplify the configuration process, we are going to use some other tools, including Helm and Helmfile. Helm is a package manager for Kubernetes. It’s an equivalent of Composer in PHP development.
The configuration which we prepared for this tutorial is the simplest implementation. We don’t want to overload you with a full production configuration which is customized to a specific project.
First, we need to get a Prometheus Operator. Take a look at this simple Helmfile configuration, which allows us to install the Prometheus stack with the desired configuration:
From time to time, we’re going to go through some parts of the configuration file for Prometheus stack. Every code block called prometheus-stack-values.yaml refers to a file with values that can be found in charts-config/prometheus-operator/values.yaml.
In the part of the file we see below, there are adjustments of basic resources for Prometheus. We enabled some additional components to gather more information about the K8s cluster.
Choosing how to grab data from the application
Now, we need to select an endpoint which we want to use to get data from the application.
We have two options:
- to create configuration in our kind application – we will need to configure each application in one place
- to create configuration in a specific application – developers will be able to maintain this configuration and it will be easy to pin/unpin next applications
We are going to go with the second way, which is much better when we need to handle more than one application. Also, it’s easier to maintain for developers.
To approach our goal we’re going to use serviceMonitor.
Service monitors allow us to monitor external services, collect exposed data and grab data from new services with little extra configuration.
All we need to do to start using service monitor with our k8s cluster is this:
That’s all. 🙂
Now, we need to start our cluster and run:
kubectl apply -f <config_directory> -R
Kubernetes will know which endpoint it should ask and how to do that.
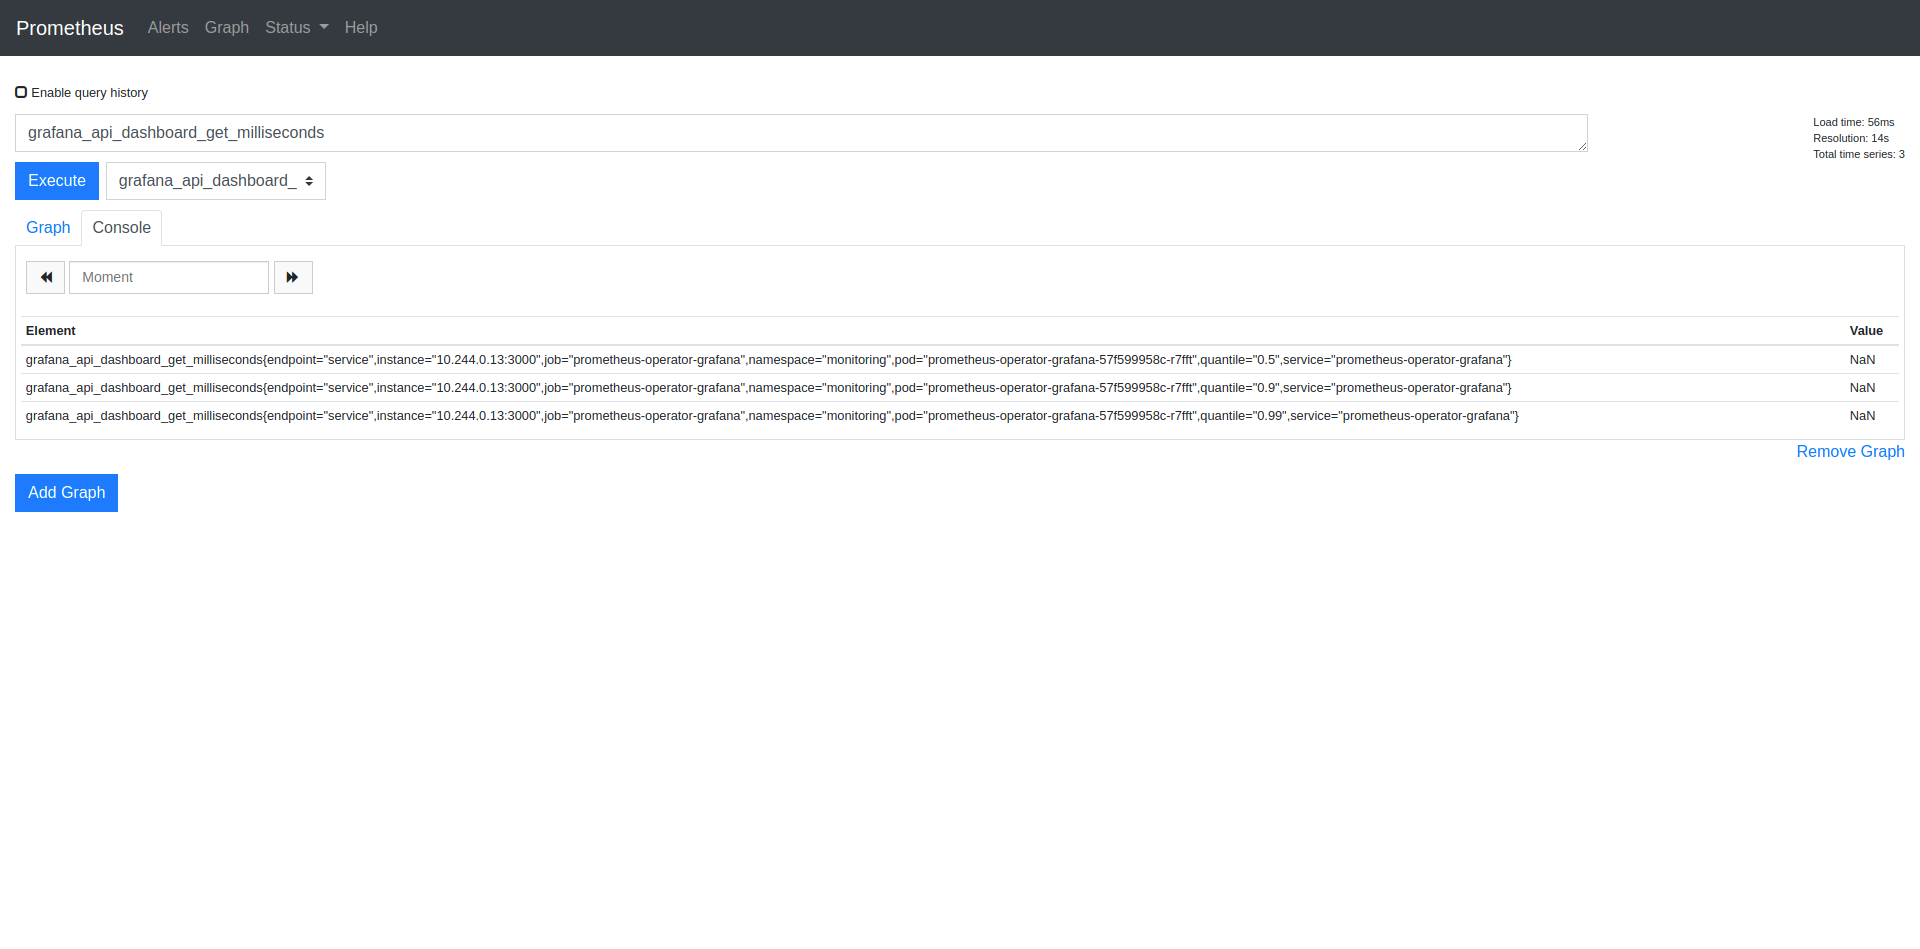
Prometheus dashboard
We expose data in the application and then we grab it using a service monitor. Now it’s time to check the data which we prepared. By default, Prometheus has its own dashboard to check metrics.
If you use the application, which we are just configuring, you can simply start it with the command:
This command exposes the Prometheus dashboard on 9090 port.
A correct link to dashboard: http://127.0.01:9090
The dashboard should be similar to this one.
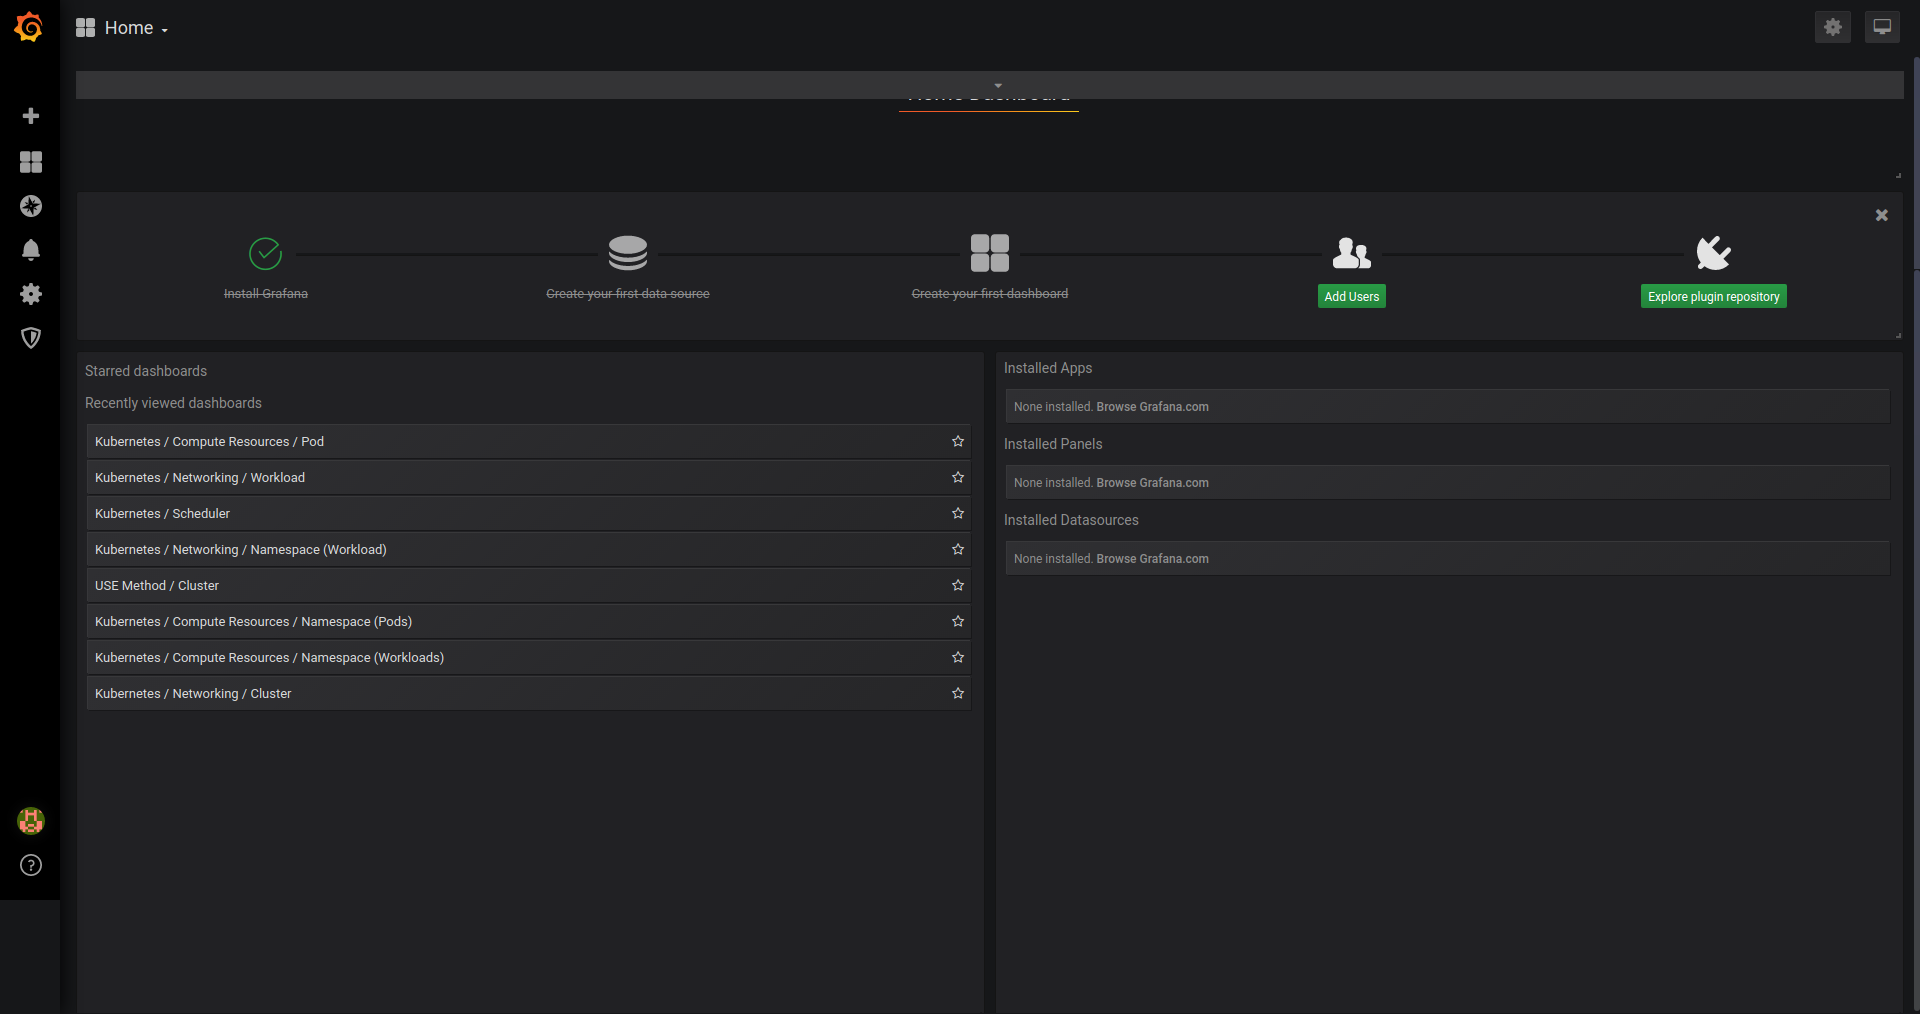
Time for Grafana integration
Prometheus operator is a great tool – it delivers the Grafana dashboard by default. We don’t need to worry about much. We just need to do some additional customizations in the application to improve our Grafana experience.
Below, you can see part of the configuration for Grafana. It is worth mentioning that Prometheus Operator uses the official Grafana chart to provide a dashboarding system. It means that we can use all the configuration possibilities presented in the documentation.
And that’s all!
We can start it with the command:
kubectl port-forward –namespace monitoring service/prometheus-operator-grafana 3000:80
Now you can access it at http://127.0.01:3000.
Prometheus data collection – summary
And that’s it! We managed to do quite a lot of work today. We:
- generated traffic data for the application,
- configured the app and automated the process with Prometheus Operator, Helm and Helmfile on a local Kubernetes installation from kind,
- selected application endpoints to get data from and grabbed the data with Service monitor,
- configured the Grafana chart.
With Kubernetes, Kind and Helm, we managed to create a simple application instance which is integrated with Prometheus! Of course, the type of application you’re going to build in real-life is quite a bit more complex than this one. But with this background, you’re going to succeed nonetheless. If you haven’t yet, return to the first part of this series to learn more about different projects we developed with Prometheus (link above).
And if you have, you can proceed to the next installment of the series, where we are going to show you how you can present the metrics in a beautiful way.
And if you need a skilled DevOps team to do such things and more for you, contact TSH and schedule free consultations!
TSH's CTO Marek Gajda advises you hire an experienced DevOps at the beginning of your project.
Why does it matter so much? Learn all of that and more from our State of Microservices 2020 report!

