07 September 2021
Performance testing without programming skills with k6 browser recorder


Performance testing, much like automated testing, seems like a complex task meant for people with a highly technical background. However, thanks to various modern frameworks and tools, the barrier-to-entry is lower than ever before. It creates opportunities for less technical users to get into it. One such tool is k6 and its browser add-on k6 Browser Recorder. Let’s see how you can do performance testing with it.
In this tutorial for non-technical users, we’re going to show you how to conduct performance testing with k6.
How to get started with k6 performance testing?
Setting up an account
Let’s start by setting up a k6 account. To do that, follow this k6 registration link.
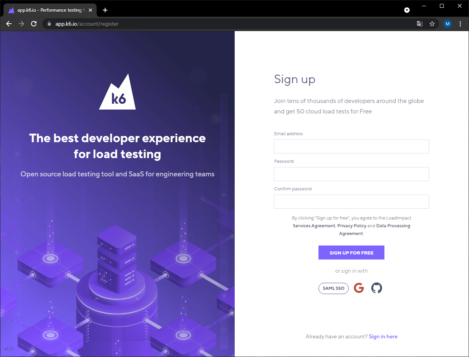
What follows is a standard registration process. You need to provide your email address and password. Then, you wait to get the activation URL.
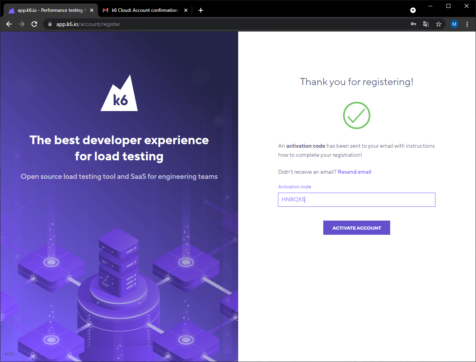
Click the ‘Activate Account” button. Congratulations –you’ve just registered your k6 account!
Installing the k6 Browser Recorder plugin
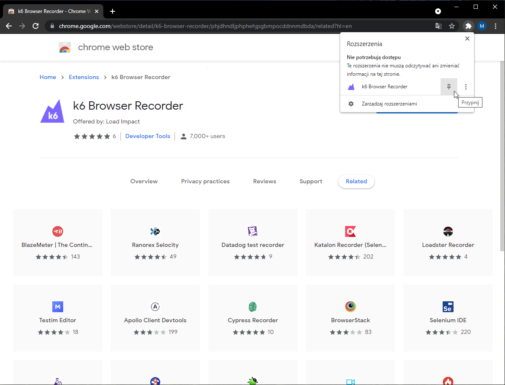
You can now install the k6 Browser Recorder plugin. It has support for two major web browsers – Chrome and Firefox. This tutorial uses the Chrome version.
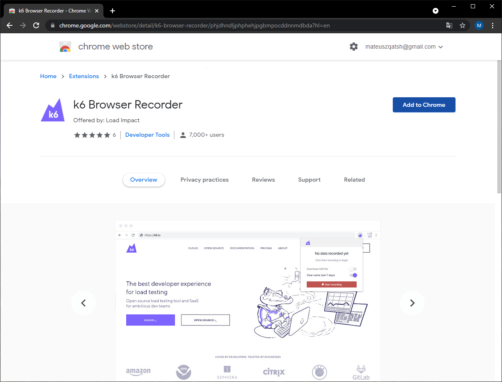
Click the “Add to Chrome” button and then add the extension.
Now, find the “puzzle” icon associated with extensions and use the pin icon to add the plugin to the browser sidebar.
How to use the k6 Browser Recorder plugin?
Let’s start with some best practices of using the k6 plugin.
What’s definitely recommended:
- browse the page in a way the user naturally would,
- take breaks the user typically would in order to read all the content,
- focus on the most frequent use cases, not all possible use cases,
- pay particular attention to pages that include forms. You may be forced to execute additional scripts if you want to use dynamic values.
At the same time, you should not:
- visit every single page in one session,
- click every possible option available,
- browse as quickly as possible,
- navigate away from your actual site or application.
Let’s start recording!
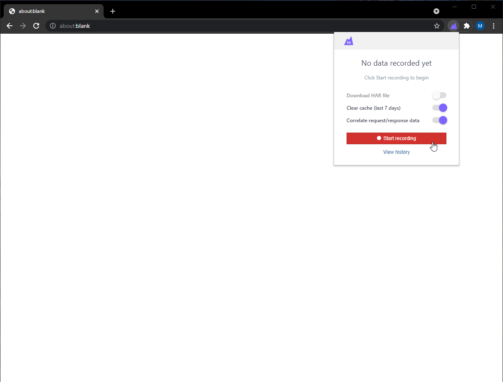
Start by opening your Chrome browser and typing “about:blank” in the upper bar. Click “enter”.
It allows you to start a new recording session from a blank state.
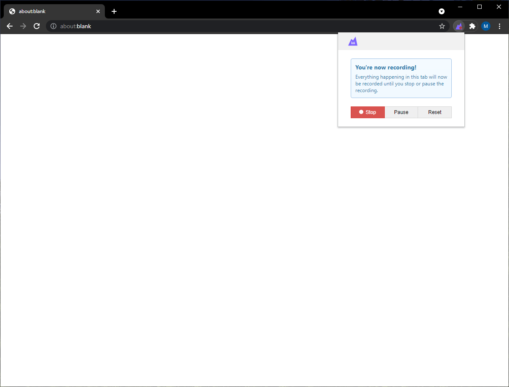
Activate the plugin in the upper right corner of the browser. Click the “Start recording” button.
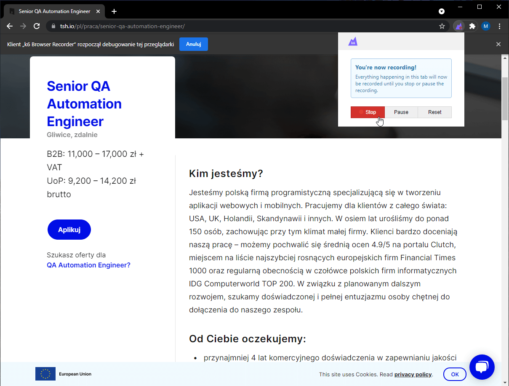
For this tutorial, we prepared a simple path for the site https://tsh.io/:
- Paste the address above to the browser bar.
- Click “Enter”.
- Pick the “Career” page in the upper menu.
- Click the “Check out offers” button.
- Click the Senior QA Automation Engineer tile.
- Scroll down the page.
- Finish the recording by first clicking the plugin icon and then the “Stop” button.
The new page opens automatically in a new tab. You can now save the recorded test, name it and set various parameters.
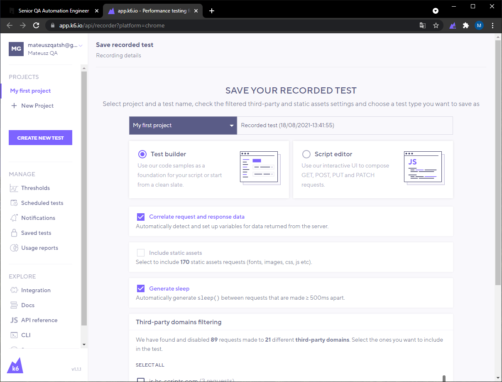
We decided to keep the default “Recorded test (18/08/2021-13:41:55)” name.
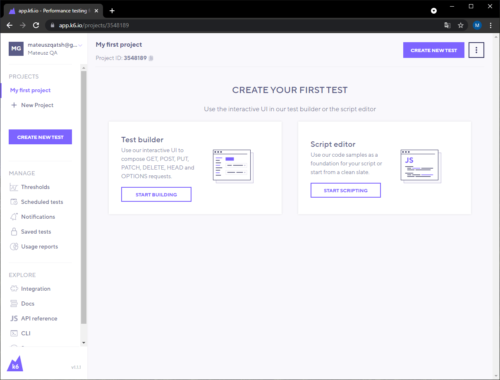
The test will be stored in the newly created default folder titled “My first project”. Next, there are two options to choose from: “Test builder” or “Script editor”.
As a non-technical person, you should pick “Test builder”. This view is much more user-friendly. Additionally, you can always switch between the “Test builder” and “Script editor” views later on.
There are now 3 parameters to set:
- “Correlate request and response data” – it automatically detects and sets variables for data returned by the server.
- “Include static assets” – it includes static resources such as fonts, images, CSS, JS files and others.
- “Generate sleep” – it automatically generates a break between requests, which are made in less than 500 msec from each other.
In this case, you should pick parameter number 1 and 3. The resources brought by parameter 2 could potentially influence the results of the test.
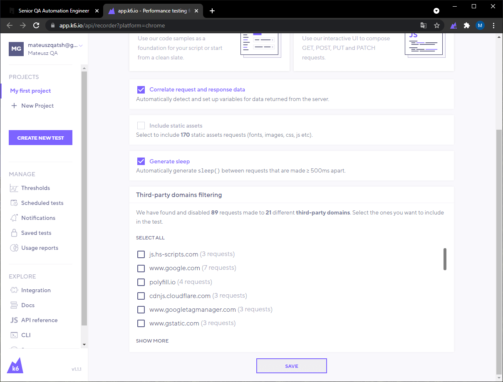
The last section is the “Third-party domains filtering”. It displays requests made to external domains. There is definitely no need for third-party requests to be included in the test.
Now you can click the “Save” button.
You are now redirected to the page of the recorded test displayed in the “Builder” mode.
k6 test recording analysis
Launching the test in the k6 Cloud
All you need to do at this point is click the “RUN” button in the upper right corner, wait for the results and start the analysis. First, though, you should check the “Requests” tab, which shows all the pages and requests you managed to record. The “Ramping VUs” tab on the other hand allows you to set parameters for the test.
Start with the “Request” tab. You should see the three pages (endpoints), which you visited and all the requests/queries made. In addition, you can observe how much time passed between requests thanks to the “sleep” tab.
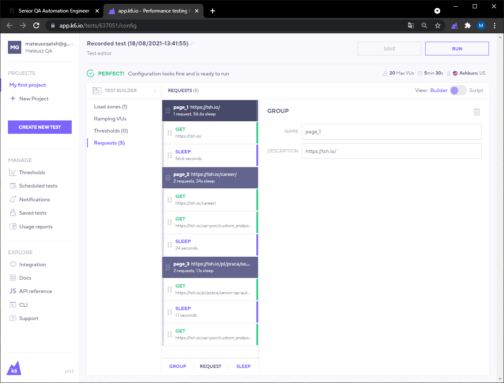
Page 1: https://tsh.io/
request GET
sleep
Page 2: https://tsh.io/career/
request GET
request GET
sleep
Page 3: https://tsh.io/pl/praca/senior-qa-automation-engineer/
request GET
sleep
request GET
Once you are sure that you recorded everything you wanted, you can go to the “Ramping VUs” tab to define all the necessary test parameters. You can review various types of tests in our previous k6 article. In this case, you should go for the load test:
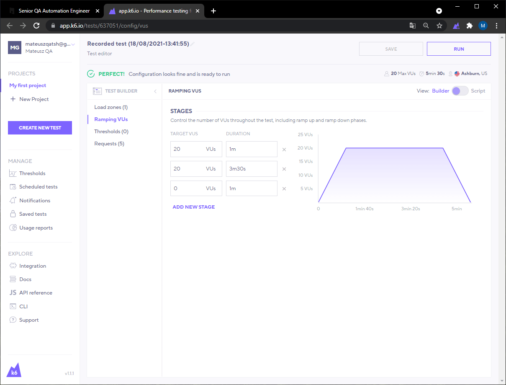
The parameters say that the number of users will go up for the first minute until the number is 20. It will remain 20 for the next 3,5 minutes. Then, the number will gradually go down to 0 in one minute. The graph to the right of the parameters shows all that clearly.
Click the “SAVE” button to keep the configuration and then the “RUN” button to conduct the test.
You should see a graphic that says that the test is ready. Wait for resources to be assigned to the test.
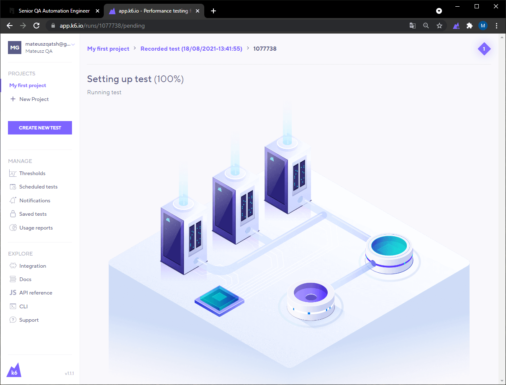
The test will begin shortly. You can see the results being generated in real-time, which makes it much easier to understand the whole process.
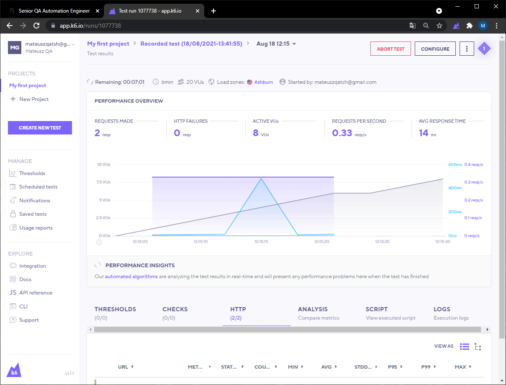
When the results appear, you can finally start the analysis.
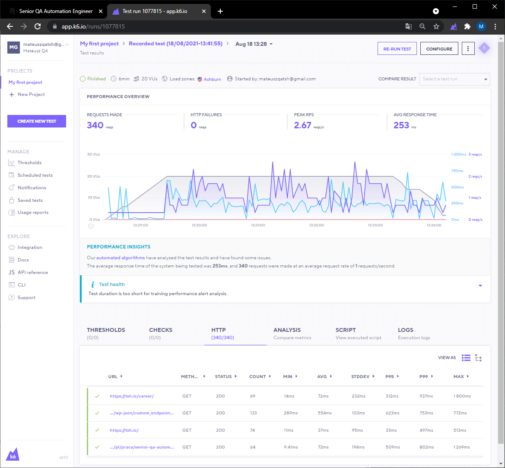
There are a couple of tools to help you with displaying and analyzing the results. In the upper right corner you can click the 3 dots and choose the “Generate PDF summary” button or export the data in a different form:
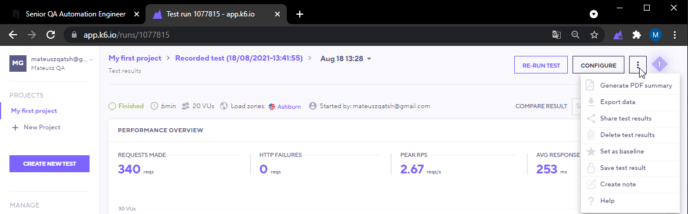
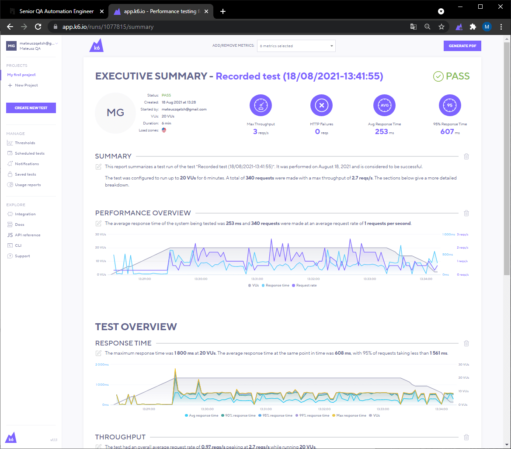
The “Generate PDF summary” option allows you to download a PDF file, which includes the test results presented clearly in charts and diagrams.
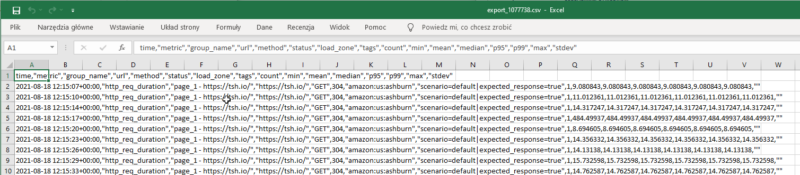
The “Export data” option downloads a .csv file populated with the test results.
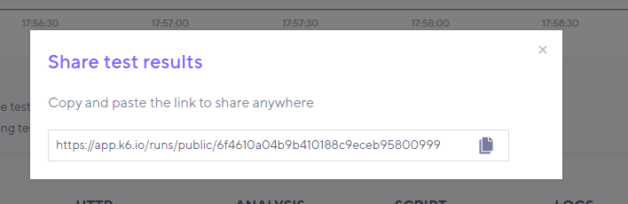
The “share test results” option provides you with a sharable link with the test results.
Using the k6 testing script locally
That’s it for the cloud-based tests using k6 resources. Now, you can try to download the script to your computer and use its computing power to do the same. In this example, you’re going to need the Visual Studio Code editor.
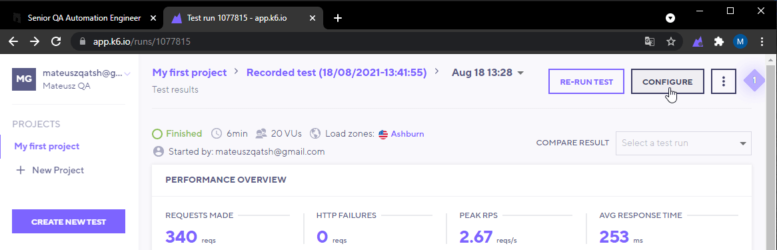
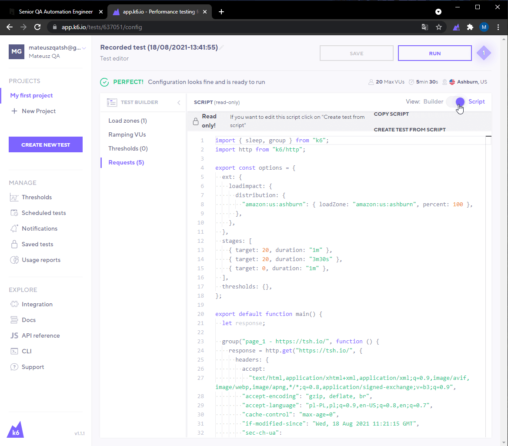
Start by downloading the script. In order to do that, click the “Configure” button.
Now you can switch the view from “Builder” to “Script”.
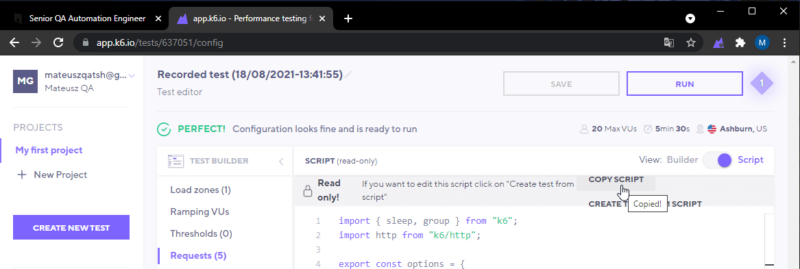
Open any text editor and paste the copied text. Change the extension of the file to “.js” and its name to “script”.
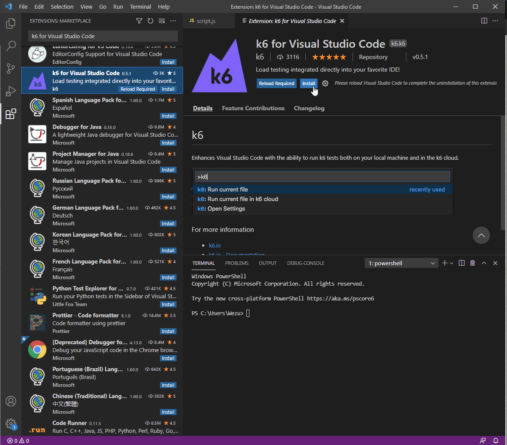
Open Visual Studio Code. Install an extension called “k6 for Visual Studio Code”. You can do it by clicking the 4-square icon in the left sidebar menu called “Extensions”. Type “k6 for Visual Studio Code” in the search bar. Now click and install the extension.
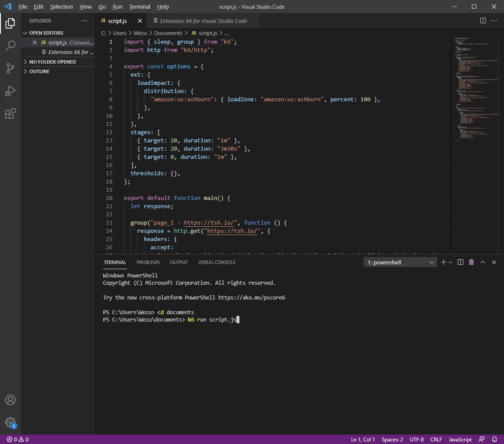
Choose the test file you just created. Click “File” in the upper menu of Visual Studio Code and then “Open File…”. Choose the “script.js” file.
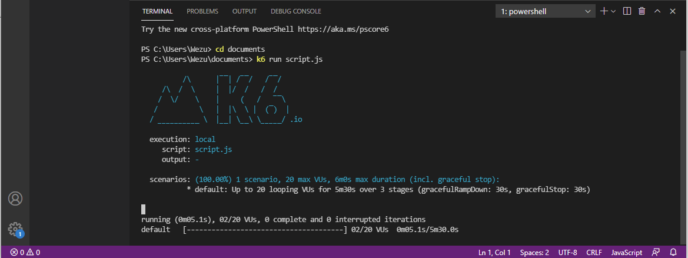
You can launch the script in the terminal by using the “k6 run script.js” command (the path in the terminal has to point to the directory in which the file is located).
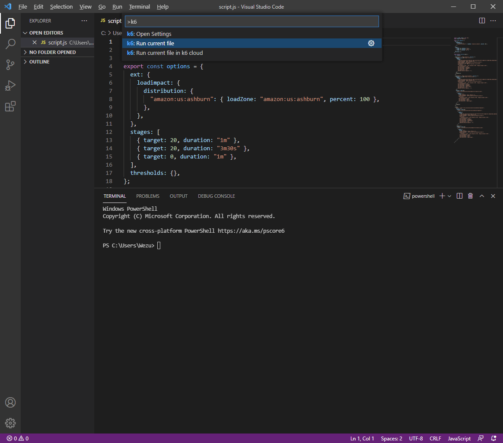
Optionally, you can launch the script by choosing using the “CMD/CTRL + Shift + P” shortcut and then choosing “k6: Run the current file: in the command window.
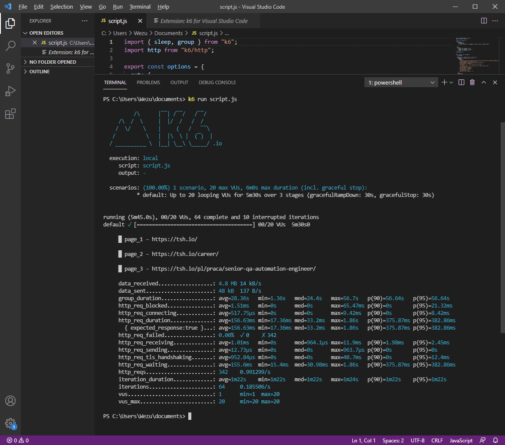
Congratulations, you managed to successfully run the test. Now you need to wait for it to be completed.
When it is complete, you can access the results and get on with the analysis.
Want even more k6 content?
In our previous article on how to do performance testing with k6 tool, you could read about a variety of performance tests and their benefits with practical examples full of code for advanced users. When you have your script ready, you can use this knowledge to conduct them all, including traditional load tests, smoke tests, stress tests or soak tests.
As you can, creating performance tests for an application is not all that hard or complex. At the very least, it doesn’t have to be. You can do a lot with just the “k6 Browser Recorder” plugin. Armed with that and the knowledge about various performance tests, you have all you need to improve the quality of your application. So get yourself ready and master the k6 framework. It’s well within your reach!
Do you know how often frontend developers do not get help from any QA specialists in their every day work?
In the State of Frontend 2020 report, you’re going to find out the percentage of such projects as well as many other interesting QA/frontend facts. Download it or read online!

