24 October 2019
Continuous Integration for E2E tests (1/4): Cypress and Mochawesome reporting


Introducing E2E testing as part of your Continuous Integration process can be challenging, but it also provides tons of benefits for the quality and scalability of your application. Let’s delve deeper into this topic, starting with learning how to generate beautiful testing reports for your clients with Cypress, using simple examples based on an actual project.
In this article, which is the 1st part of a larger series on E2E testing and continuous integration, I’m going to go over the process of configuring reports for a simple project using the Cypress tool and a simple example project (repository included). Stay tuned for the remaining articles, in which I’m going to talk about test configuration with Circle CI, Bitbucket Pipelines and the Slack messaging platform.
Reports have always been an important aspect of testing and creating useful reports is something of a trend in QA. Everyone would agree that what clients really want to know is the actual state of their system, not how the tests themselves work. With proper reporting, we can tell them if the software functions properly, what errors were discovered and how they affected the system. We can also determine the duration of each test and the very specific spot in the codebase which causes test fails.

Essential packages
I’ll show you now how to configure mochawesome reports. Let’s start by installing all the necessary packages. A good piece of advice is not to use the “mocha”: “latest” command. The latest version is usually unstable and it may have a negative impact on the generated reports.
    "mocha": "5.2.0",
    "mochawesome": "4.1.0",
    "mochawesome-merge": "2.0.1",
    "mochawesome-report-generator": "4.0.1"
Report configuration in cypress.json
Now, let’s add our reporter’s configuration to the cypress.json file. Much like before, I avoided “reporter”: “mochawesome” due to stability issues.
    "reporter": "./node_modules/mochawesome/src/mochawesome.js",
    "reporterOptions": {
      "reportDir": "cypress/reports/separate-reports",
      "overwrite": false,
      "html": false,
      "json": true
    }
Let’s explain what’s happening here:
- reportDir – it’s the directory to which we’re going to output the results of our tests.
- The overwrite flag – toggles the rule that allows/disallows overwriting previous reports.
- The html flag – generates a report when a test is completed.
- The json flag – generates a json file for each completed test.
Let’s get to the script configuration.
Script configuration in package.json
If there was just one file with spec tests in the project, we could simply set the html flag to true and that would be enough for a fully functional custom reporter. Unfortunately, if we were to run tests on a few files, the custom HTML report would be generated for each of them separately. Since time and convenience are important considerations for us, we want all the reports to be included in one file.
There is quite a simple way to solve this problem and get a proper, fully compatible reporter.
    "clean-reports":"rm -rf cypress/reports",
    "test": "npx cypress run",
    "merge-report": "npx mochawesome-merge --reportDir cypress/reports/separate-reports
 cypress/reports/full_report.json",
    "generate-report": "npx mochawesome-report-generator --reportDir cypress/reports
cypress/reports/full_report.json",
    "after:tests": "npm run merge-report; npm run generate-report",
    "cypress": "npm run clean-reports; npm run test; npm run after:tests"
- “clean:reports” – removes the directory that contain reports before new tests are run (a script can be added in order to generate timestampted reports. With that, there won’t be any need to remove the directory anymore. Otherwise, the report will include data from previously run tests).
- “tests” – launches tests through Cypress.
- “report:merge-report” – combines all the generated json reports for every single test file in one report.
- “report:generate-report” – generates a complete HTML report from the merged json file.
Now that we have the report, let’s take a closer look at the data it provides.
The report overview
Right in the top bar, there are some basic information on:
- No. of verified test files.
- No. of tests included in the files.
- No. of tests with a positive result
- No. of tests with a negative result.
- Duration of all tests.

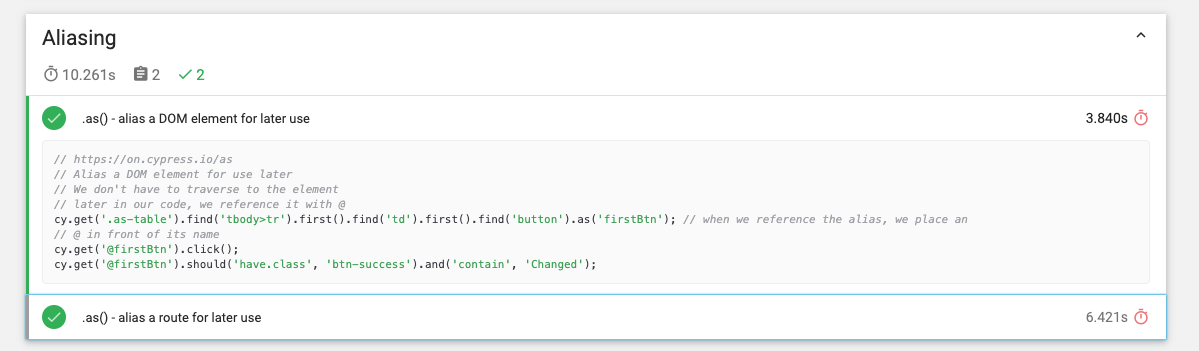
Below, there is detailed information on specific tests. We can check the following:
- Duration of each test.
- How long it took for a test to conclude in a given describe.
- The actual code that was the subject of verification.
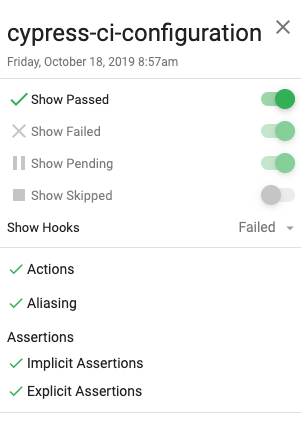
In the upper left corner, there is another menu which allows us to find out a couple more things:
- Filtering all tests by a result (passed / failed / pending / skipped).
- Navigation (useful if the lists include a lot of tests).
- The date when each test was run.
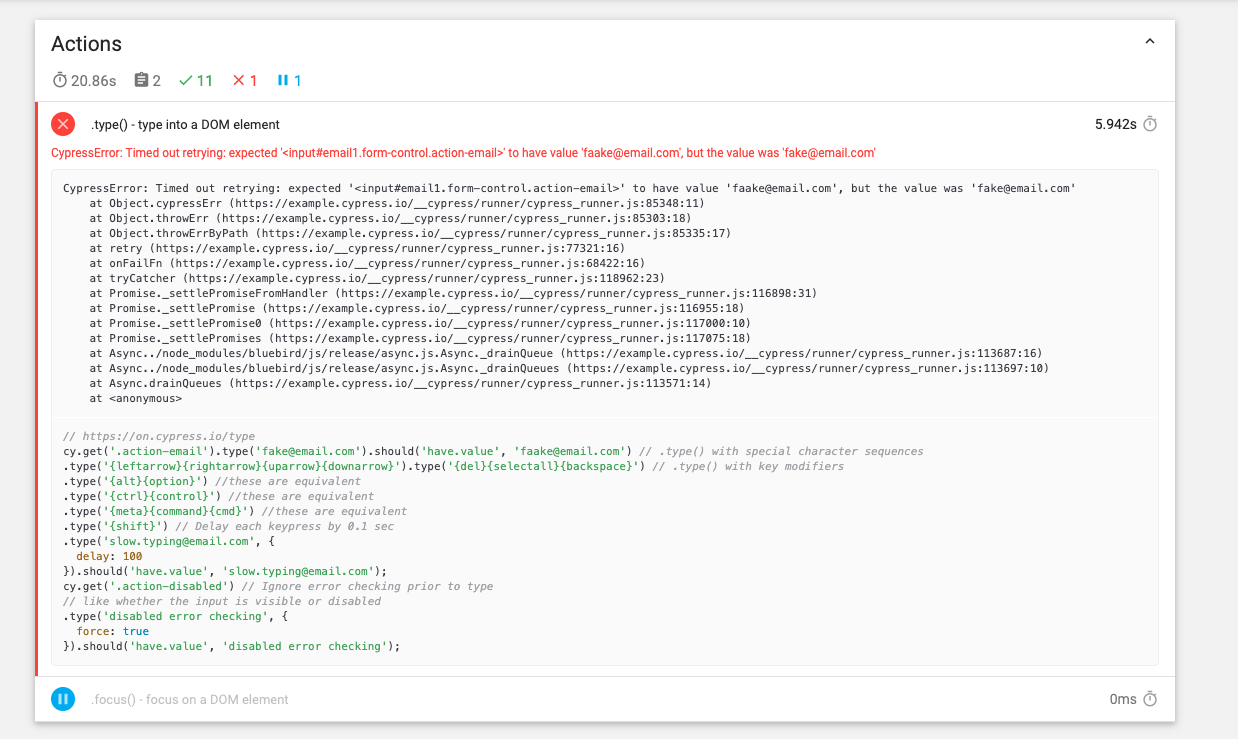
Negative tests and filtering
Below, we can see an example of a test which ended with a failed result. Full access to the error’s stacktrace and a cause of the failed result are provided. In this case, the mail was at fault.
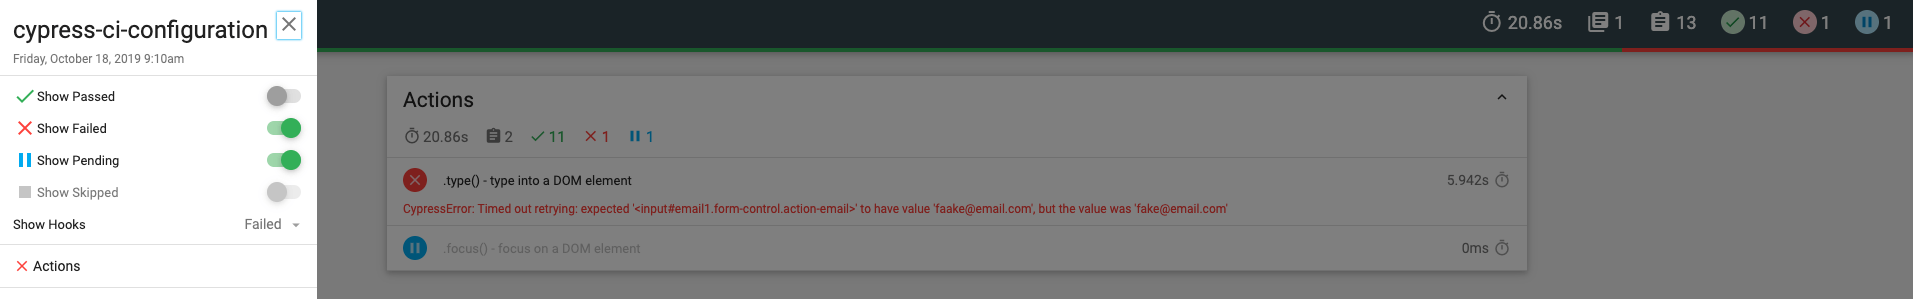
Below, we can also see an example of filtering run to quickly find tests that are failed or pending.
And that’s basically it. If you want to learn even more about the topic, including other related topics such as HTML report mochawesome merge, check my repository with the example project. Get more information on the mochawesome custom reporter used in the article as well as other reporters compatible with Cypress. And if you want to check a report from an actual project, go check another of my Cypress projects on GitHub.
Did you know that our State of Frontend report includes a section dedicated to Quality Assurance?
Get your free copy and find out why as many as 80 percent of all frontend developers perform software tests themselves and the number keeps on rising every year.

