04 February 2021
Console object tricks & other secrets of developer tools


In our daily work as web developers (not only frontend specialists), one tool that everyone tends to use a lot is the developer console. The leading browsers on the market all constantly come up with newer and newer functions and mechanisms that facilitate everyday work and support the debugging process. Most developers use this tool to view errors and display data using the (in)famous console.log() function. However, the potential of this tool is much bigger. It requires learning more about the console object which is exactly what I’m having you do today.
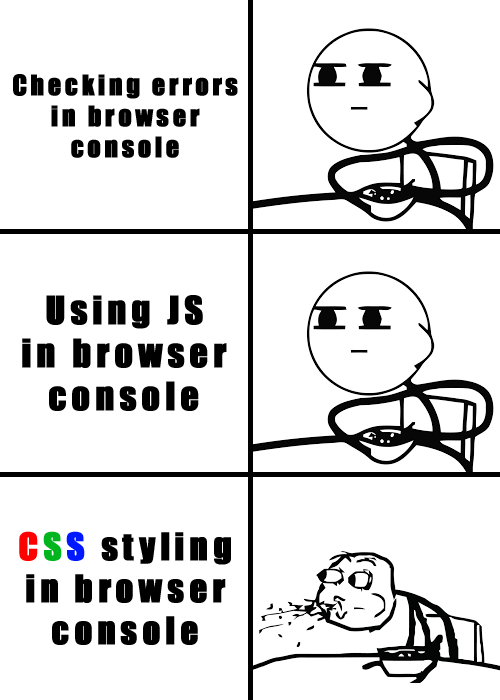
I know, I know:

But chances are you can really do a lot more with it than you expect. They really do offer a very fine-tuned access to the browser’s capabilities.
Without further ado, let’s get right to it!
The console window looks quite similar in most browsers (you can use Firefox, Chrome, Opera or any other browser you like, its debugging console will work just as well) and you can invoke it by default with the F12 key (fn + F12 on Mac). In addition to reading information from the page, you can execute special commands, modify the DOM or execute any JS code:
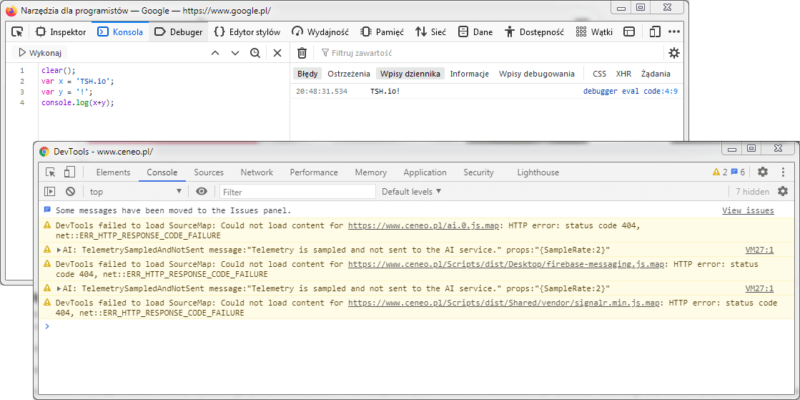
As you can see, it gives you a wide range of possibilities to test and check various elements of the website being built. A useful parameter for quick content editing on the website is:
document.body.contentEditable=true;
Calling it in the console will allow you to freely edit all texts on the page, which may be useful not only for programmers but also for copywriters and testers.
The console object
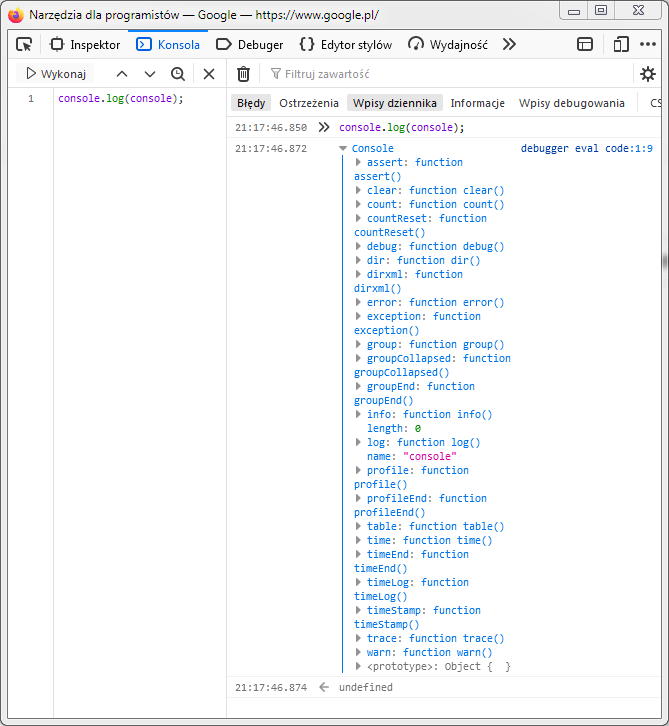
The most frequently used object in the browser console in everyday work is definitely the… console object. While everyone uses its log() method to display data, the console object provides a lot more possibilities, the list of which can be easily viewed by running the following command:
console.log(console);
As you can see, the console object provides quite a lot of interesting functions. I’m going to go over some of the most important ones.
The most frequently used object in the browser console in everyday work is definitely the… console object
The log & dir methods in the developer console
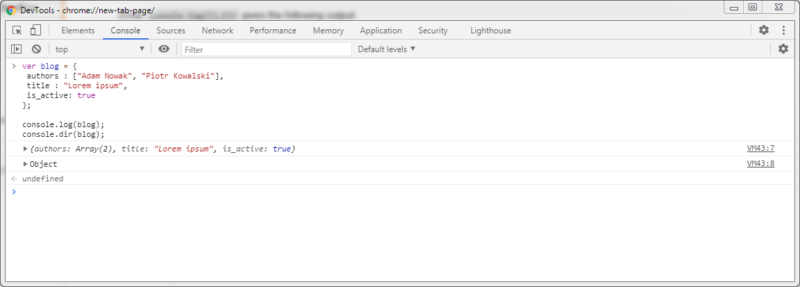
As I already mentioned, the most frequently used developer console method in the debugging process is log(). It has a counterpart: dir(). So what’s the difference between them?
Well, the first one shows you only the data given in the parameter, transforming it into a string, while the dir() function displays the full tree, which includes the type of given data. It provides a different, more complete view of the variables being checked.
Multiple log levels in the developer console
When testing software, you can log various types of content within the console object, taking into account specific types (levels). You can choose from:
error – to log error message in the application,
warn – outputs a message with a warning
info – for information texts,
debug – logs entries with the debug flag.
These different types of content of the console object appear in the console as follows:
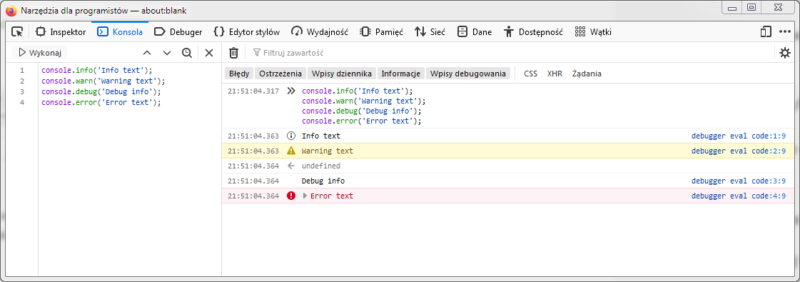
To sum things up, you can use it to create error message, warning message, provide information or add devug flags, with the error message and warning message being the most common one.
Table function in the developer console
Is it possible to display complex data structures somewhat more conveniently?
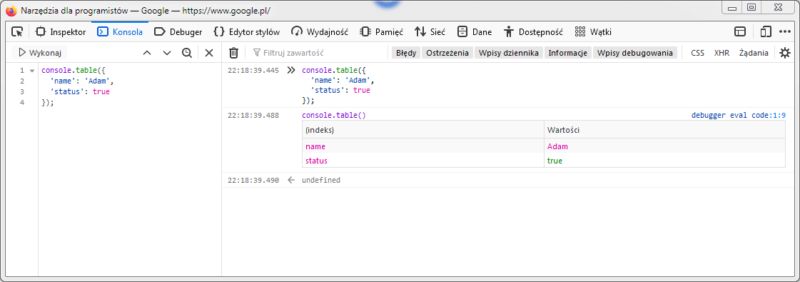
Naturally! The table() function comes in handy as it presents data in the form of an easy-to-read table. This mechanism for tabular data can be a great support for previewing complicated JSONs coming from the API. An example:
Timers in the developer console
The console also allows you to conveniently measure the time of command execution. For this purpose, you can use the following functions:
- console.time() – starts the timer,
- console.timeLog() – calling this function displays the current timer status,
- console.timeEnd() – ends the timer.
Custom log styling in the developer console
The content presented in the console does not have to be visually archaic. By adding CSS style to console.log() as parameters, you can replace any occurrences of %c in the console log content with the selected properties.
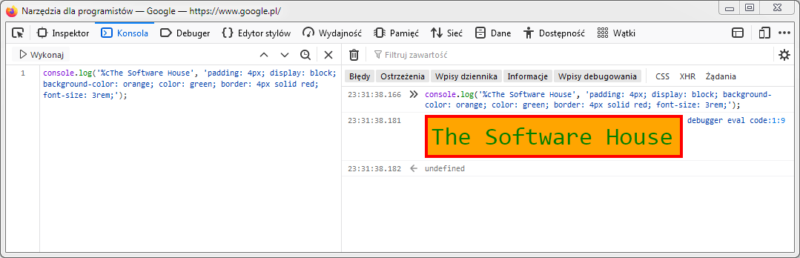
Usable CSS styles are of course limited and dependent on the browser used, but basic text formatting options and properties are fully available and should be more than enough in your daily work.
How to use styling in a developer’s work? There are many examples of such use in practice. Of course, apart from the extravagant styling of the error message (e.g. giving the red color), you can also use it for … marketing! Many IT companies “hide” messages for potential employees in this original way, along with appropriate links to recruitment processes. By leaving a trace in this way, you can attract the attention of specialists and gain industry publicity. It’s worth knowing that the developer console provides access to this.
jQuery in developer console?
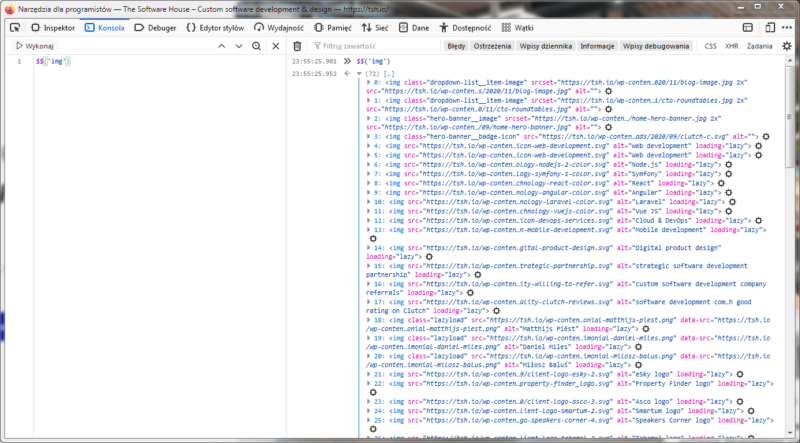
Who does not like working with jQuery? For all fans, the browser console is a very nice place to be. You can conveniently get elements from the DOM using the following functions:
$('tag')$('.class-name')$('#id-attribute')
These functions are equivalent to the document.querySelector() method. They only return the first element. If you need to return a complete list of elements matching the query, just use the double dollar sign $$. Then, an array is returned that allows you to perform further operations.
Console object and developer console tricks – summary
As you can see, the possibilities of the browser console are very wide and the potential of the access to the browser’s data it gives is very substantial. Thanks to the use of appropriate functions or possibilities offered by the JavaScript language, you can manipulate the console output data in detail, including:
Getting more information about the data with the dir method, increasing the potential of the tool as debugging console.
Logging different types of content (e.g. console warn) within the console object for testing purposes.
Displaying complex data as a table structures within the console in a convenient manner.
Using CSS in the developer console.
Running jQuery in the console.
Of course, the possibilities presented above do not cover the whole topic. Some of the available functionalities are specific to a given browser. You can learn more about them in the developer’s documentation (for example, check out this resource for Chrome DevTools). It is worth following any changes to these functionalities and looking for solutions that will best support your work in a given project. One thing is certain – the (in)famous console log does not exhaust the list of things that you can do with the JavaScript object of the console. The console object creates a new world of opportunities for you to explopre to aid you in your everyday development.
And if you want engineers that know developer tools like the back of their hand, contact The Software House. 👇

