13 February 2020
Continuous Integration for E2E tests (3/4): Bitbucket Pipelines configuration for test automation

Not that long ago, I wrote two articles about Continuous Integration for E2E tests. In the first one, I focused on producing beautiful reports with Cypress and Mochawesome, in the second – I covered CircleCI configuration for test automation. Now, it’s time to show you the Bitbucket Pipelines configuration for test automation. I’ll present the advantages of this solution and also try to briefly compare Bitbucket Pipelines to CircleCI.
Nowadays, more and more companies decide to use ready-made solutions from one supplier. Atlassian can be a great choice as it provides one ecosystem which helps you manage your project (using Jira and Confluence). At the same time, you can have a repository in the same place and use it for continuous integration.

In the article, I’ll show you how to get a fully-operating environment with CI testing in less than an hour! In my opinion, configuring Bitbucket Pipelines is way more enjoyable than doing the same with CircleCI. However, from a purely aesthetic perspective – CircleCI offers better UI and UX.
Straightforward Bitbucket Pipelines configuration
In the article about CircleCI configuration, I mentioned that you need .yml file to run Continuous Integration. Thanks to that, the tool will know what steps should be followed to open the tests with the desired configuration.
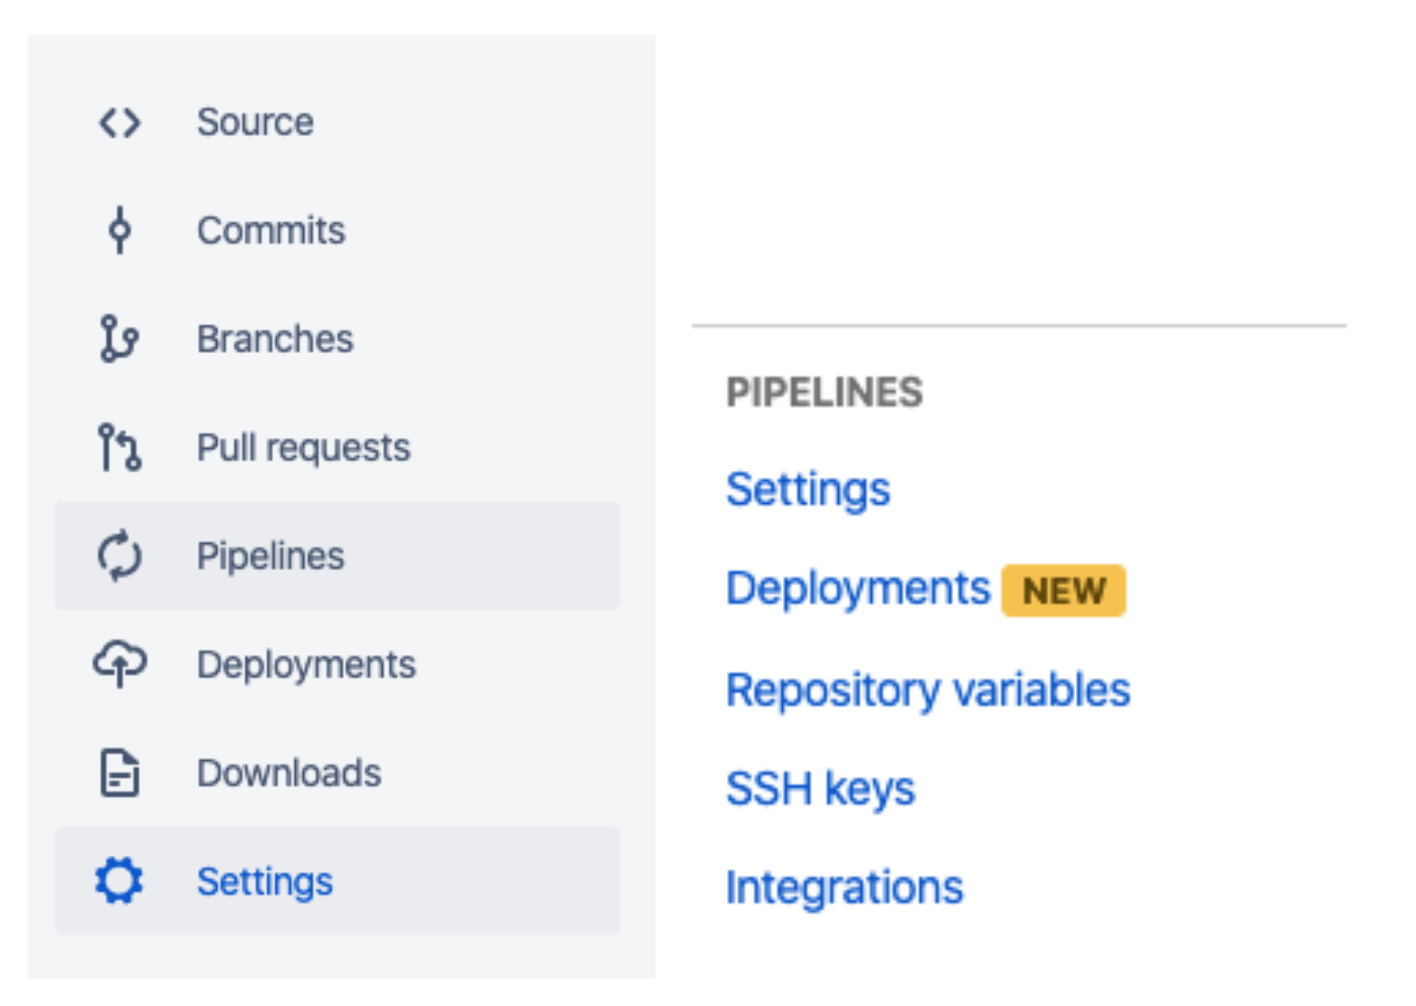
To configure it in Bitbucket, you should go to the testing repository and open “settings” from the left menu. After that, you should scroll down to the section “pipelines” and click on “settings” once again.
Then, you should enable the option of using pipelines in your project.
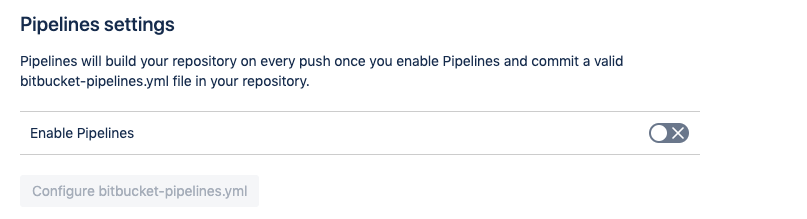
Let’s configure the bitbucket file now.
How to configure bitbucket-pipelines.yml file?
In the project’s main folder, you should create the file bitbucket-pipelines.yml.
Below, there’s an explanation of what should be provided in the code.
- image – define which Node version you want to use from Docker image,
- max-time – set the maximum duration of tests; some tests may go wrong, so I recommend limiting minutes which are intended for pipelines,
- caches – set everything you want to place in a cache; my recommendation would be to place there npm and Cypress; it can help you save some time
- image – use Docker image which was defined for Cypress,
- script – scripts which you use to run tests (npm CI) and npm run Cypress which runs tests,
- artifacts – folders you want to add to artifacts for later verification.
What about web application analysis?
Would you like to learn more?
I recommend the detailed documentation on the Atlassian website.
Let’s talk about web application analysis
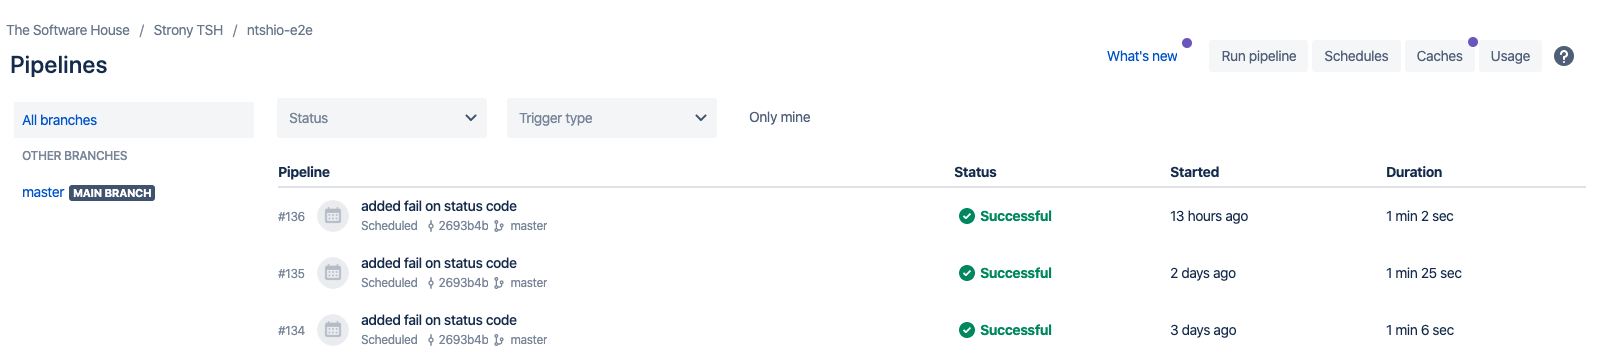
Now, when you have bitbucket-pipelines.yml file created, it’s time to verify your pipelines and its build. To do it, you should go to the project repository in Bitbucket and open the tab “pipelines” from the left menu.
You’ll see the table with all the tests which are currently running and which have been running in the past (in the current build and all the previous ones). The data you can see from the left side of the screen:
- PIPELINE – build number with the information about the branch from which the build was sent and the information about the latest commit.
- STATUS – current status of your build (possible options: Successful, Failed, Error, In Progress, Stopped or Paused).
- STARTED – information about the approximate time when the build was started.
- DURATION – information about the build duration.
If you are working in a bigger team, it’s useful to filter pipelines by statuses or trigger types (such as Push, Rerun or Scheduled).
Also, there are some useful options on the right top corner menu. You can perform some actions there. These are:
- RUN PIPELINE – you can run the current build.
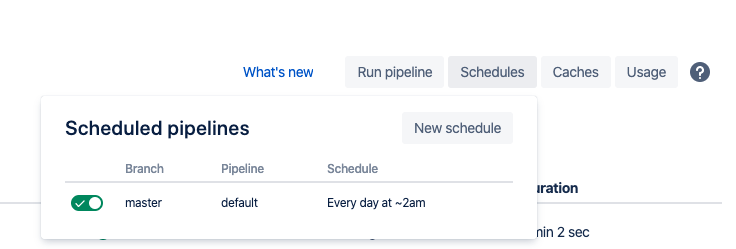
- SCHEDULES – you can check if your build is planned; if it’s not planned, you can define the branch and the pipeline. Also, you can set at what interval it should be run.
Thanks to nice toggles, all these actions are easy and intuitive to perform by users who have no experience in using tools like those. Some of the other, available options:
- CACHES – you can check which folders (and when) have been recently added to the cache.
- USAGE – you can verify how much time has been intended for this pipeline.
As you can see in the image below.
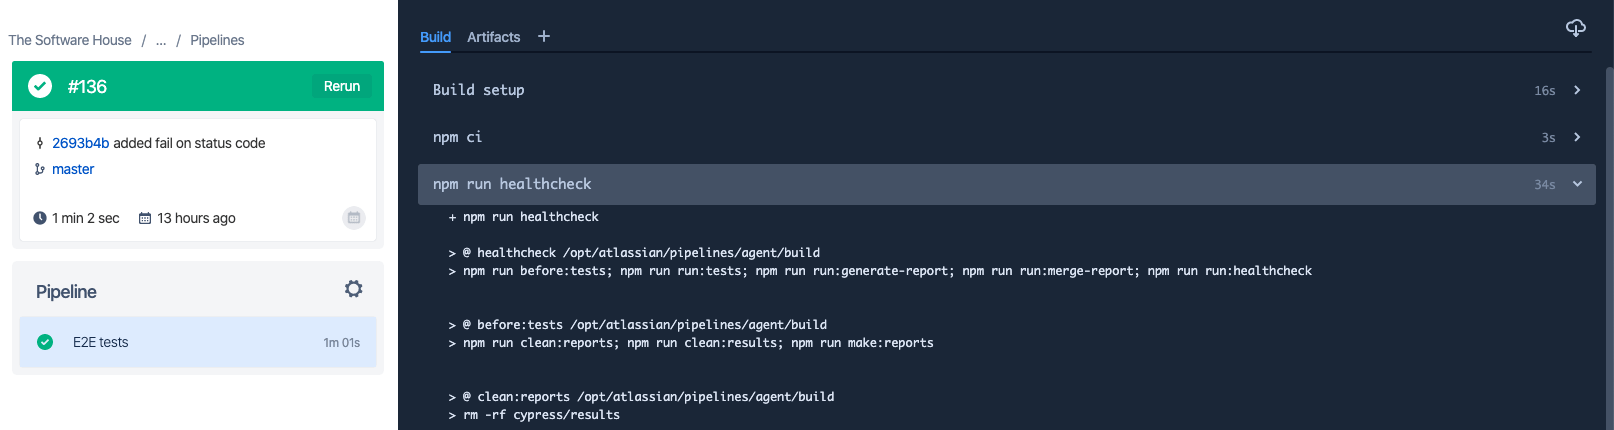
Once you open a certain build, you can check its configuration and verify which commands have been run. After expanding the chosen section, you can see detailed logs.
If tests failed, the most important bookmark is the one called “artifacts”. You can find there all the files you need (such as reports or video recordings of the tests). You have to download these files as there is no access online (in contrast to CircleCI which offers online access to those files).
Bitbucket Pipelines vs CircleCI – comparison
Advantages
Bitbucket Pipelines
- clear configuration,
- easier build-planning management.
CircleCI:
- better UI,
- easier access to artifacts – you don’t have to download those.
Disadvantages
Bitbucket Pipelines:
- you can’t preview artifacts online,
- you can only store artifacts for 7 days.
Circle CI:
- it’s more difficult to configure,
- unknown time of artifacts storage – it depends on AWS.
Let’s sum things up.
Bitbucket Pipelines configuration for test automation – summing up
As you can see, both tools have their pros and cons. Also, those work efficiently and entirely fulfill the roles. Thanks to those, you can prepare an environment for early E2E tests with the use of Cypress, Kakunin, or any other testing frameworks. I hope that now you are familiar with those tools so you can use the knowledge in a practical way to achieve a better quality of your product using continuous integration.
In the last article of this continuous integration cycle, I will focus on integrating Slack Report. Thanks to that, you can easily get the latest information about the state of your project.

