07 June 2022
The Software House’s documentation method. Make your app more scalable with software development diagrams


Everyone who ever participated in a software project knows how important it is to have good documentation. Not only can it make the development process more efficient, but it can take the product itself to the next level. At The Software House, we have developed our own way of perfecting the project documentation. How does it work? Let’s just that it really drives home the point that a picture is worth a thousand words.
You know what they say…

But have you ever wondered what really makes great documentation? Is it how much information it has? Or perhaps it is all about using precise standardized terminology?
In order to find the answer, let’s go on a journey through a number of projects we’ve had the pleasure of working on here at The Software House.
The challenge of writing good documentation
When we take over a new project from our client, we typically get a list of requirements in the form of a written document, a list, or ready-made user stories. No matter the form, the requirements typically fall into two categories:
- way too short and full of mental shortcuts taken out of context,
- extremely detailed, and comprehensive.
Which version is better. At first glance, it seems quite obvious that it’s the latter. But is it really?
Consider a scenario in which you are the Product Owner. You have just dedicated a lot of hours in order to create very comprehensive documentation. Everything is there, down to the smallest details, including all the edge cases and processes. It seems like all there is to do is for developers to sit down and write the app of all the stakeholders’ dreams. And then, one by one, those very stakeholders come to you and ask how this or that feature is supposed to work, what it is all about, and so on.
What went wrong? After all, you gave them all they needed. They have beautiful comprehensive documentation. Why do they keep asking so many questions? What can you do to prevent it?
Trust us – we’ve been there. We’ve been striving to find answers to these questions for quite a while. It came to us gradually. What is it? It has to do with… drawings.
Basics of software development diagrams
When we take over a new project, we always start by asking about the documentation. Even after we get familiar with it, we like going through the app to understand the processes that take place within it even better. That’s how we approached yet another project we got to be a part of – for a client from the gaming industry,
Documentation that does not scale – a case study
From the user’s perspective, the app seemed to be intuitive and easy to use. The mechanics were straightforward: you play, you get points, and then exchange them for various perks.
However, the more we familiarized ourselves with how the reward system worked in the documentation, the more we realized that the actual mechanism behind it is really complex. The Confluence page that contained the app’s business logic was a 20-minute read. What’s more, it included tons of hyperlinks to other documents.
Luckily for us, there were some people on board who knew the project like the back of their hands. They were there to answer our questions. But that begs another question – what if those people left the project? Who would be able to quickly debug, modify and improve the existing business logic and keep the system from falling apart?
The prospect itself is quite scary. Luckily, it doesn’t have to be that way.
Our team received new requirements. It called for updating a major functionality in a way that would make it even more complex than the current version. It would depend on a number of logical conditions. Soon after the first iteration, we decided to visualize the logic in the form of a diagram.
That’s right. Our answer to the challenge of creating a complex functionality based on even more complex documentation was to make a drawing.
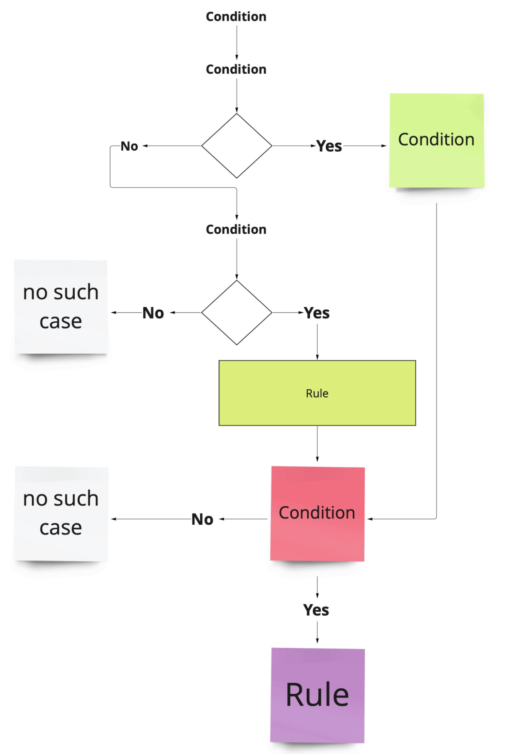
At that time, we did not use any officially standardized languages such as Business Process Model and Notation (BPMN) or the Unified Modeling Language (UML) – more on those later. On that occasion, we just drew a simple diagram, which included a number of paths the user could follow when they met various conditions. It used a simple yes-or-no logic:
Both our team at The Software House and the client quickly realized just how helpful this approach is. The diagram provided numerous benefits:
- It helped us identify some additional dependencies relevant to our implementation.
- We were also able to find gaps in the requirements. Contrary to what we were told, there were missing edge cases, which we were able to flesh out.
- The new intuitive form of documentation made it much easier for QA specialists to do their job by giving them a high-level top-down view of the system.
- The very same aspect turned out to be useful for developers as well.
The positive feedback from the client was very important for us, we succeeded in permanently changing the way documentation is made in the project. The client saw how useful it was in the long run and adapted the approach for good.
As you can see, visualizations really do make a difference. But there is more to that than scalability.
We’ll now show you another case study, in which diagrams helped us get a hold of a big project that featured complex logic, compounded by the presence of numerous third-party pieces of software.
Misunderstanding, mental shortcuts? Visualizations to the rescue – a case study
It doesn’t take a logistics expert to know how the package delivery process works. It starts with moving the package from one warehouse to another and then to the customer. However, when we joined a project for a logistics company, it turned out that the whole logic of managing deliveries, goods, and warehouses is way harder than it seems.
To make matters even more complicated, the project used Google’s Blockly – a visual code editor add-on for web and mobile applications. The tool added rules that modified available booking slots for deliveries. Once again, in order to fully understand how it works, we used diagrams.
Written requirements are quite error-prone due to their sheer size. It is also possible that imprecise terminology or mental shortcuts can create misunderstandings for the readers. Diagrams take care of these shortcomings. They make it possible to present the logic in the form of a tree of dependencies that is easy and objective enough to put everyone on the same page rapidly.
Much like before, a simple diagram made it easier to establish proper communication between us and the client. However, this time it also improved communication within the team, removing the fear of misunderstanding written words, which, after all, are open to interpretation.
After experiencing so many benefits of diagrams first-hand, we moved to invest even more effort into using them. We wanted to make diagrams a staple of our development process.
This called for a more systematic approach to this issue. Enter…
Modeling languages at The Software House
Diagrams aren’t anything new in software development. UML diagrams debuted back in 1996, while BPMN got its beginning in 2004. Despite that, up until recently, we haven’t got to use them much in practice.
There is an ongoing debate within the business analyst community regarding the need to meticulously adhere to official standardized languages. It’s a very complex subject. In addition to different modeling languages, there are also many types of diagrams in complex software systems, including: communication diagrams, package diagrams, behavioral diagrams, interaction diagrams, structural diagrams, state machine diagrams, sequence diagrams, component diagrams, class diagrams, timing diagrams, activity diagrams, or the deployment diagram, interaction overview diagram, composite structure diagram, class diagram, and object diagram. And that’s hardly a complete list!
However, at The Software House, we found a way to incorporate standardized modeling languages seamlessly into our process. We typically use them at specific stages of the project, when we learn in detail about the requirements for creating a new app or functionality from the client.
Naturally, we haven’t given up on simpler ad-hoc diagrams. We use them during project workshops in order to quickly visualize ideas for the client. Next, we move our visualizations into standardized languages. We find BPMN especially helpful due to the crystal clear way of representing events it provides.
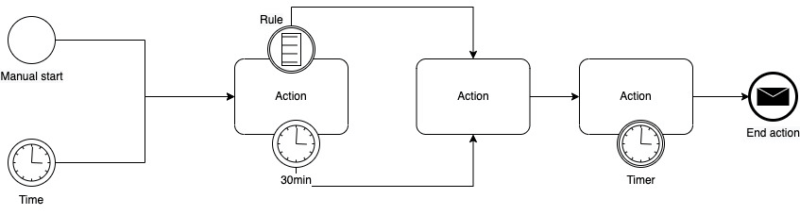
Thanks to BPMN, we can design simple processes such as this one:
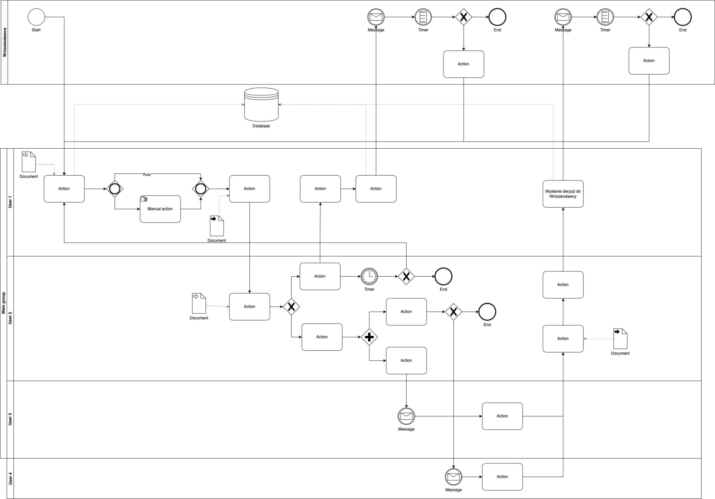
We can also go for something more complex:
Just recently, we had a chance to work with BPMN on a project from the educational sector.
Using standardized modeling languages at TSH – a case study
Our task was to revamp and optimize the management system of our client. Both employees and clients used the panel to manage their time and schedule meetings. There were multiple processes and types of users involved. We had to find the business processes that provide the most value and bring more focus to them.
When we start a new project, there is always a storm of ideas coming from a lot of people at the same time. We weighed them against the requirements gathered from the client and visualized them using BPMN.
Over the course of the project, we noticed that various types of team members benefit from the visualizations:
- Programmers can easily map their code to the system as a whole. One glance at the diagram puts their work in the context.
- Designers understand how various parts of the systems work with each other. Thanks to that, they create designs that match business requirements with fewer iterations.
- Diagrams were also useful for all new team members, regardless of their role. It eased and sped up the process of really getting into the project.
- You can separate user stories from business processes. It makes it easier to identify and close all user paths.
- The diagrams were also found to be useful to plan the work for future sprints.
Once the high-level work was done, we were able to use diagrams to go even deeper into the system.
A top-down approach
Diagrams continued to be very useful at a stage when we decided to divide the system into smaller processes and describe all of their business and technical aspects.
The UML diagram (all types of UML diagrams) is one option to choose for that kind of work, but at The Software House, we especially enjoy the C4 model. As a matter of fact, C4 is a leaner graphical notation technique largely based on UML. After creating UML diagrams for a long time, we realized that some elements could be done faster using C4. We used it to visualize the system’s architecture as well as the containers and components that comprise it.
Modeling language – pros and cons
We determined some of the most common pros and cons of using standardized data visualization and modeling languages such as BPMN or UML. They are based on feedback we received from all types of users, including PMs, QA specialists, software developers, and designers.
The pros
These are some of the most common pros mentioned by all project members.
1. Standardized naming
Every industry has its own jargon. The Product Owner tries their best to get all team members familiar with at least the basics of it, but it is almost never enough. Visualizing the system and ideas goes a long way to amend that. It abstracts away the jargon. In addition to that, when you don’t understand something, you can always just point with your finger (or mouse cursor).
2. Benefits of the DRY principle
DRY stands for don’t repeat yourself. To many developers, it is one of the most important principles of good programming. When adhered to properly, it makes the system more efficient and scalable.
Diagrams help you stick to DRY because they make it much easier to put together in your head how this whole system is supposed to work, what belongs where etc. Of course, doing so with written text isn’t impossible, but it appears that many developers that work with such documentation resort to trying to draw it anyway.
3. Making sense of complex logic
Breaking down a big problem into a bunch of smaller ones is useful, but it takes some time. Sometimes, even the small ones take hours of time you spend consulting with various specialists, gathering requirements, closing knowledge gaps, and so on. We realized that many of those hardships are avoidable as long as there are diagrams to show everyone the way. It translates into hours of time saved.
4. Streamlined documentation development
Diagram-as-a-documentation is also quite a convenient model. You need documentation anyway – why not make it in the form of visualizations? And when requirements change, all you need to do is update the diagram. In our experience, it takes much less time than going through bulky written documentation in order to edit all mentions of a given phrase.
The cons
There are some complaints about diagrams in software development.
1. Frequent diagram revalidation
There are projects in which requirements change very frequently. Every time it happens, you need to update and revalidate your diagrams with your team. It’s worth doing, but it does take time.
2. Barrier-to-entry for standardized languages
While well-designed simple diagrams are highly intuitive and take no more than a couple of minutes to understand, the same is not always true for those that adhere to standardized notations such as BPMN or UML. They introduce jargon on their own. New team members need to learn it. Luckily, this knowledge is highly transferable.
All in all, it seems like the pros of diagrams greatly outweigh the cons.
If you and your team are willing to put in the time and effort to learn standardized graphical representation and modeling languages, you’re not going to regret it.
Want to learn even more about documenting software architecture? Check out the article from The Software House’s VP of Technology Adam Polak for more expert tips on software documentation
Software development diagrams to the rescue?
Over the last few years, we have made data visualization a crucial part of our method of project setup and takeover.
We use it to create the entire documentation as well as business logic. We rely on it for cooperation with clients and with each other. It became an integral part of the whole development process. We went from simple ad-hoc diagrams to implementing standardized graphical representation languages and methods. In the process, we learned that:
- Even detailed documentation might not be very helpful to someone that didn’t participate in its creation.
- The bigger and older the project, the more of a problem non-intuitive documentation is.
- By introducing simple graphs, you can save time, find bugs, and gain new insights into the system.
- By introducing standardized languages, you can effectively improve all the aspects that make up the process of developing and maintaining a software project.
As for the answer to the question at the beginning of the article: great documentation is one that immediately provides a newbie with all the context and high-level information they need to understand how the system works and what they can do to make it even better.

