25 July 2023
Keep your Lighthouse score high for Next.js applications with this checklist

Some say that web performance is important. I say that this is the understatement of the year! Not only is web performance key to your business success and the satisfaction of users, but it is also typically indicative of the current health of your entire system. That’s where your whole healing process for your app should begin! Luckily, with the Lighthouse Score, it’s much easier than you might think. Let’s find out in practice what the Lighthouse Score really is.
Let’s talk about one of the most useful technical performance tools that can be used to test web pages. It’s automated, and measures performance, accessibility, and SEO. What’s more, it’s open-source and free to use – and can be used to test progressive web applications, which is what I’d like to concentrate on in this article.
What you’ll learn
Today, performance is so much more than just the time it takes to render an app. Bad performance leads to poor UX and worse SEO positioning – a domino effect of bad outcomes that hurt your app.
Web apps’ SEO performance became one of the hottest topics during the last few years. We as developers often forget about it until it’s too late. It’s often caused by strict deadlines, lack of knowledge, or just laziness. It will also be a very important topic of this checklist article, which includes:
- the importance of speed in assessing overall app performance according to the latest 2023 trends,
- the 6 Web Vitals explained,
- the impact of font choices on the Lighthouse score,
- a word or two about the importance of keeping your scripts under control,
- a little on the value of pure CSS,
- an analysis of bundles and their role in keeping the app light(house),
- a little something called the Cumulative Layout Shift,
- a classic page speed culprit – images,
- JavaScript and its role,
- various ways to maintain good results.
Let’s run through Lighthouse scores success checklist together. I’m sure that soon you’ll see just how much this Google Lighthouse audit can change your site performance. But first, let’s go over a little basic information about it:
How does speed affect your app’s performance?
Did you know that Google has been looking at web speed in terms of ranking since 2010?
Google and page speed – algorithm changes
- In 2010, Google announced that page speed will be taken into account by ranking algorithms for searches by users on desktop devices.
- In December 2017 Google switched to the “mobile-first” approach and then In January 2018 it started to use page speed as a ranking factor for mobile searches.
- In May 2020 Google announced that they will be measuring overall page experience and will use it in its ranking algorithms. Page experience is based on many signals, including:
- Core Web Vitals (loading performance, First Input Delay for interactivity, Cumulative Layout Shift (CLS) for visual stability,
- Mobile-Friendliness,
- HTTPS,
- No intrusive interstitials.
- In the march 2023 Core Algorithm Update, Google once again introduced changes with the goal of increasing the importance of user experience as a ranking factor.
Did you know about the massive impact app performance has on UX and even revenue? Here are some facts from the study, “The need for mobile speed”, by Google:
The need for speed by Google
- 53% of mobile website visitors leave a site if it takes more than 3 seconds to load
- 25% higher viewability was observed for sites that loaded in 5 seconds instead of 19 seconds
- 3 out of 4 top mobile sites take more than 10 seconds to load
- 2x more revenue was observed for sites that loaded in 5 seconds instead of 19 seconds
But don’t worry, I’ve prepared a checklist that can help you increase the overall speed of your app, enhancing UX, SEO and revenue at the same time. Because the Lighthouse report was made by Google, the Lighthouse performance scoring uses the same performance metrics and helps to improve your progressive web app in a clear and intuitive way.
Web Vitals in Lighthouse reports
Let’s get started with improving your Lighthouse performance score. Before we can proceed with concrete tips and tricks, let’s first learn how Lighthouse understands and calculates the performance score.
Lighthouse is an open-source, automated tool for improving the quality of web pages. You can run it against any web page, public or requiring authentication. It has audits for performance, accessibility, progressive web apps, SEO, and more.
The performance section of Lighthouse measures the page speed based on 6 Web Vitals.
Web Vitals is an initiative by Google to provide unified guidance for quality signals that are essential to delivering a great user experience on the web.
Let’s go through each of them in summary:
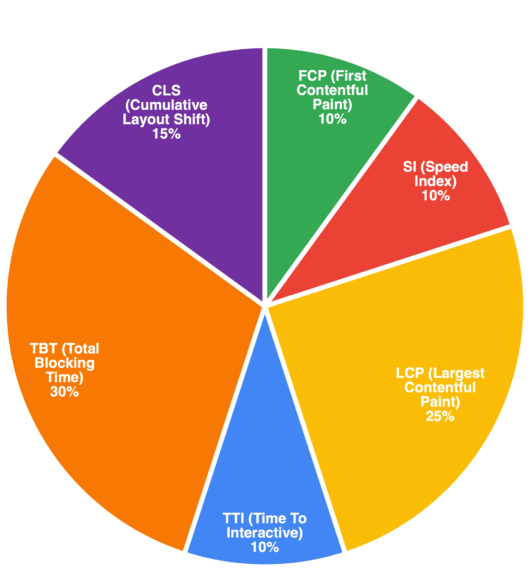
- FCP- First Contentful Paint- measures how much time our application needs to render the first elements in DOM during the initial visit.
- SI – Speed Index – measures how fast our application fills with content. Lighthouse creates a filmstrip and then compares the frames with each other.
- LCP – Largest Contentful Paint – measures how long it takes to render the largest element in DOM in the initial viewport.
- TTI – Time To Interactive – measures when the application is ready to interact with the users. For Lighthouse it means that we’ve rendered all the content in the initial viewport and registered the events.
- TBT – Total Blocking Time – Measures the impact of “long tasks” (Tasks that take longer than 50ms) in our application and is the difference between FCP and TTI. How does it work? Let’s take a look at this example:
Our application contains 20 tasks:
- 10 tasks take 40 msec each
- 10 tasks take 60 msec each
TBT only cares about the 60 msec tasks (to be more precise, the difference between the 50-msec threshold and the value itself). So our end result will be:
AMOUNT x (VALUE – THRESHOLD) = RESULT
10 x (60ms – 50ms) = 100ms
- CLS – Cumulative Layout Shift – all of the unexpected shifts in layout in the initial viewport. Value is calculated based on the distance that the “unstable” element has moved between frames.
With this knowledge, we can finally proceed to “fixing” our application Lighthouse score!
Fixing fonts
Why do fonts affect your lighthouse score? It’s because the way they’re employed not only affects page speed (different fonts have different sizes, and we don’t just mean how big they look!) but can have a deep impact on how viewers see your page when they don’t load correctly. Here are some things to be wary of:
- Self-hosted – Avoid loading font files from external services which you don’t have control over. Whenever you can, you should either self-host the files to avoid longer HTTP requests or use CDN hosting with caching.
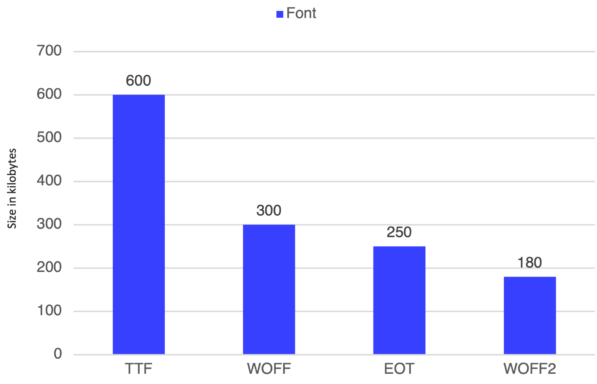
- Font extensions – Font extensions have a massive impact on the final size of the file. If the font of your choice comes with different extension choices, you should always pick WOFF2, which is the lightest one.
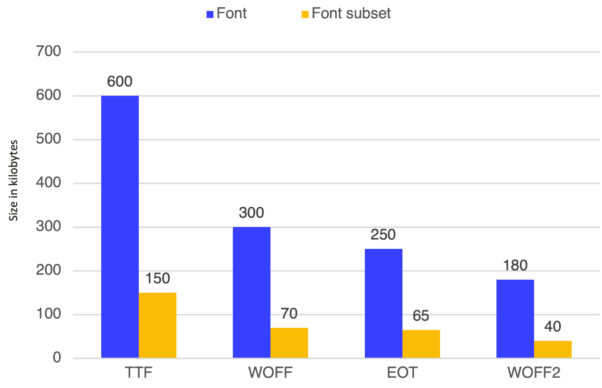
Font subsets – Some fonts have smaller variants called “subsets”. They contain less glyphs which further reduces the size of the file. For example, some fonts have “Latin” subsets that only contain the Latin alphabet letters and characters.
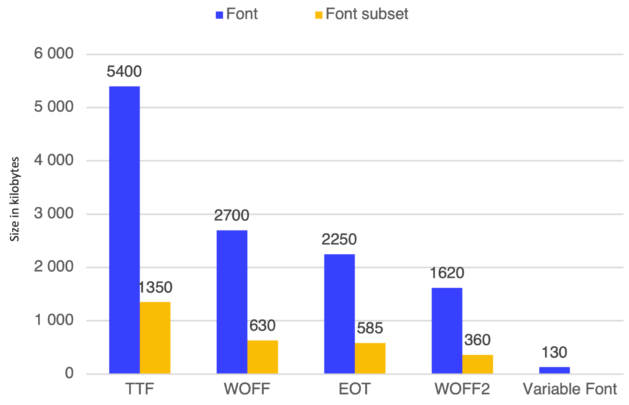
- Variable Fonts – enables multiple variations of a typeface to be incorporated into a single file, so instead of loading an “X” amount of different files with different variants, we can load only one file which is usually smaller than all the files combined.
Let’s say that we would like to use all the variants of the font (in this example it’s 9 files). We’ll multiply previous results by 9, and compare its size with a single Variable Font file.
Scripts
Scripts can affect your performance as well – especially if they bottleneck in places they’re not wanted or take up precious loading time. The best ways to make them easier on your performance are:
- Asynchronously loading – Quote: “There is no third party code that is more important than your application code”. Always defer loading third-party scripts with either async or defer to prevent blocking the application’s main thread. You can also use next/script which allows you to set up the priority of the script.
- Resource hints – Use resource hints wisely to further decrease the time needed to load the script. You can learn more about them here
Tag Managers – Consider delegating the loading of third-party scripts to tag managers, where you can have better control over the order of scripts loading and the number of scripts.
Styles
CSS over CSS-in-JS solutions! 👇
In terms of styling, you might want to consider a more “old-fashioned” way of doing things. Because in SSR applications, we don’t want to overwhelm the main thread with more JavaScript. That’s why CSS-in-JS solutions are not the best fit for the Next.js application.
You can check this article which compares those two approaches. Additionally, `Next.js` has plenty of CSS optimizations built-in already, like class names and styles minification, sass support, configured postcss, so it’s a way to go for us.
Font-display – to avoid FOUT (flash of unstyled text) or seeing a blank screen you should always control the loading of the font by using font-display property on your font face.
Interested in more technical SEO?
Take a look at our technical checklist for PHP applications
Bundles
Analyzing bundles can lead to great findings of the amount and size of our chunks. We can often learn a lot from tools that do just that.
- Bundle-wizard – This is a cool alternative to @next/bundle-analyzer which allows us to inspect our application bundles. In my opinion, it has 3 big advantages over the other tool.
- It has a nicer UI to navigate
- It provides coverage of the chunks
- It can be run over any deployed application not only during build
- Chunks splitting – a good way to decrease the bundles’ size is splitting them up into smaller pieces. It is easier for our application to load multiple smaller chunks rather than a few massive ones. Fortunately, webpack does allow us to split merged chunks.
We can do it like this in next.config:
This way, the @sentry package will be split into its own small chunk. Additionally, we can control the priority of the module.
Removing duplicated modules
Sometimes while working in monorepo architecture, we can end up with packages that were bundled multiple times. Again, web pack config comes in handy with a property that will merge our duplicated chunks. It looks like this:
CLS
CLS became a ranking factor in 2021, so it’s fairly new. It stands for Cumulative Layout Shift, and it’s a metric used to take the temperature of user experience.
A layout shift occurs any time a visible element changes its position from one rendered frame to the next. A nice presentation of CLS in actions is shown below:
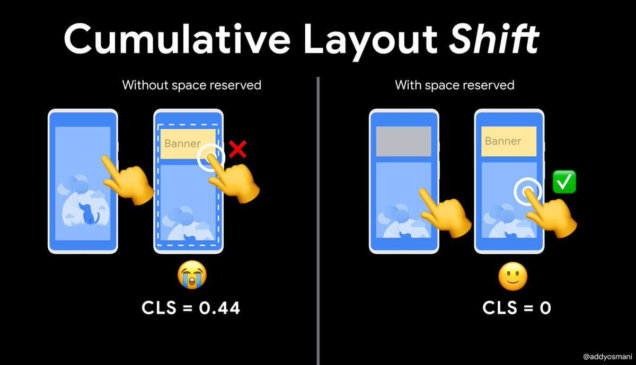
Preserve space for dynamic content – to prevent any unexpected shifts of layouts we should always preserve the space for the content which hasn’t been rendered yet.
There are great approaches out there like skeleton loading which mimics the general look of a given component, including its width and height. This way we will preserve the exact space and therefore eliminate the CLS.
But sometimes, we don’t have to use anything fancy. We can just insert an empty placeholder box, which will just ensure that there are no unpleasant shifts for users.
Images
Images are probably the most infamous of page speed villains, and this problem is as true now as it was in 1999. Except there are more tricks we have up our sleeves to make this a non-issue and improve your overall performance score. Here we go:
- New generation file extensions – consider serving images in webp or jpeg2000 file extension. It’s much lighter than traditional jpeg or png without noticeable quality loss. There are many libraries that can convert the image to webp during its upload, so feel free to use them. But always remember that some older browsers might not support the extension, so prepare a fallback version in the applicable format.
- Size variants – Lighthouse does recommend serving the images in different variants per breakpoint. Libraries like sharp allow us to generate multiple sizes of the same image. To display them we can use either <picture> tag or the img srcSet property and all of the “magic” will be handled for us by the browser.
- Lazy loading – always defer loading images that are outside the viewport. In that way, we can save time during the first visit to our page. To achieve that, we can use loading=”lazy” property on img tag.
- Preloading – consider preloading the images which are above the fold — especially the LCP element. Preload link “tells” the browser to fetch the content earlier than it would normally be.
Next/image – doing all of the above points by hand might be time-consuming and problematic. Fortunately, there are libraries out there that will handle it for us. One of these is Next/Image component, which will optimize the images for us, by converting to webp, resizing, lazy loading, and preloading API.
JavaScript
Sometimes JavaScript can become the villain when it comes to SEO performance. There are some common mistakes we can avoid in order to raise the app’s Lighthouse Score:
- Code splitting (dynamic import) – code splitting allows us to defer loading of some code and therefore it reduces the amount of work that the main thread of our application has to do. Next/dynamic is a great tool for splitting code. With a simple API, we are able to split components into separate chunks which will be loaded on demand. We can also control whether the component should render on Server Side or not.
- Avoid barrel files – we have a tendency to create barrel files with multiple exports. They’re convenient to import from but might become a pain point for us in the future. If the tree-shaking process isn’t working, then each individual import will import the whole “library”.
So instead of:
We would like to import directly from the components path:
How to keep the performance high
If we’ve already achieved the performance level that satisfies us, it would be good to keep it at the same level over time. We can’t call it a Friday yet! There are a few tools that can help us to do this:
- Bundle-wizard – It’s a good practice to run this tool from time to time while our app is growing, to make sure that bundle sizes remain low, and that we don’t have any unexpected issues with chunks.
- Webpack performance hints – performance hints from webpack are a good indicator for us to run bundle-wizard. They are really easy to set up and configure, giving us the opportunity to throw warnings or errors during the build when any of the app chunks does exceed the size limit.
- PageSpeed Insights / Lighthouse – of course, our main tool for measuring the app’s performance is Lighthouse. We can run it from dev tools in Chrome browser, or through the PSI website.
- WebPageTest – is a cool alternative to Lighthouse. It measures Web Vitals for us as well but gives us much more information in a more accessible way. For example, we can see the waterfall of tasks or the filmstrip of the rendering process.
- Lighthouse-CI – with Lighthouse-CI, we can set up tests for specific metrics or the whole performance score on our CI process. In that way, we can consistently measure the page speed as the app is growing.
- Measuring real users’ performance – that’s a tip for the apps that are already out on production and have some active users. Measuring real users’ performance is a key for understanding where our weak points are.
Tools like Lighthouse or WebPageTest can sometimes be misleading because they always work on a stable internet connection, the latest version of Chrome, etc… And that is not always the case for our end users. Often the user’s performance on a given page may be much worse than Lighthouse would suggest.
Personally, I recommend Sentry’s performance measurement tool. It’s super easy to set up and will provide plenty of information about the user device, connection, location, etc, which might help us address the edge-case issues.
The Lighthouse score wrap-up – targeting web app performance continuity
I hope that this article showed that a properly set up workflow can:
- prevent us from pushing bad code that will demolish our app performance,
- catch errors during the implementation process,
- and even point out the pain points which we should look at.
Web App performance is not something we can fix once and forget about it. It’s more like a process of checking, analyzing, and improving the application constantly as it grows. Fortunately, we can and should automate this process as much as possible to make our lives easier.
Concerned about your app's SEO?
Get the technical SEO requirements right from the start – consult with us!

