23 November 2022
Tech study: Data lake on AWS will increase the efficiency of your data analysts by 25 percent
Wouldn’t it be nice to spend less time on data engineering and more on making the right business decisions? We helped revamp the client’s system in a way that made it possible for data scientists to have instant access to the company’s information. As a result, they could get more insights from it. How did we do it? The short answer is by implementing a data lake. Want to know more? Check out the whole tech study.
By skilfully implementing the data lake on AWS, we were able to provide quick, orderly, and universal access to a great wealth of data to the entirety of the client’s organization. Just take a look!
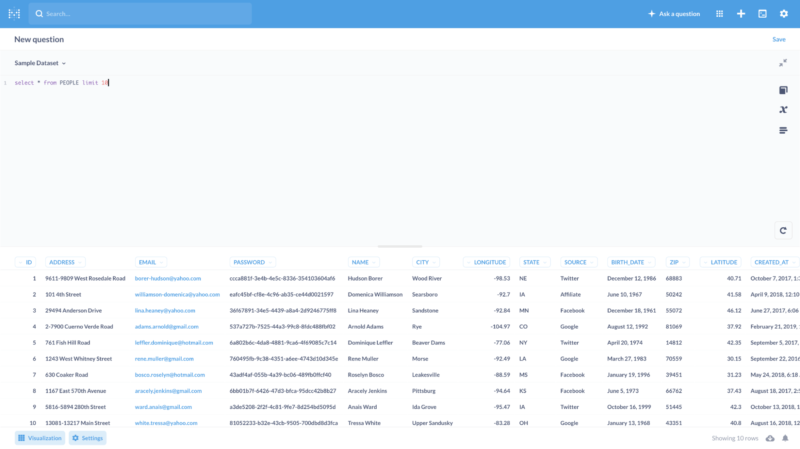
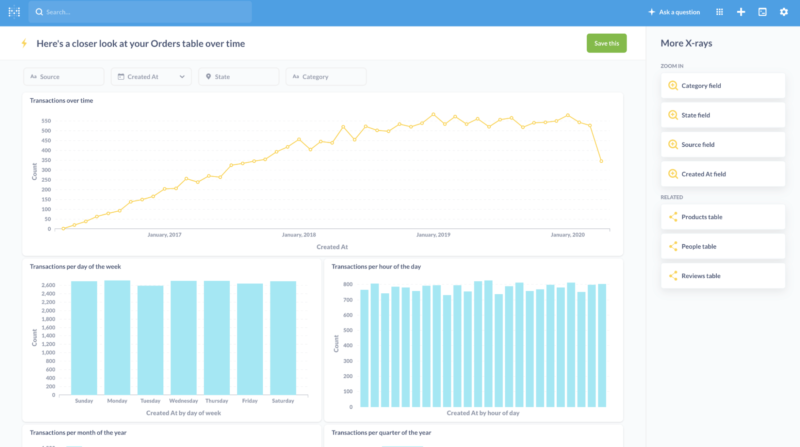
As a result of that change, the company’s internal team could create new types of charts and dashboards full of unique insights that cut right through knowledge silos that previously blocked this intelligence from being gathered together.
Cloud-based projects like this one are what we love to do at The Software House. We suggest taking a look at our cloud development and DevOps services page to learn more about our exact approach, skills, and experience.
Meanwhile, let’s take a step back and give this story a more proper explanation.
Background – fintech company in search of efficient data system
One of the most prized characteristics of a seasoned developer is their ability to choose the optimal solution to a given problem from any number of possibilities. Making the right choice is going to impact both present and future operations on a business and technical level.
We got to demonstrate this ability in a recent project. Our client was interested in boosting its business capabilities. As the company was growing larger and larger, it became increasingly difficult to scale its operations without the proper knowledge that it could only gain through deep and thorough analysis. Unfortunately, at that point in time, they lacked the tools and mechanisms to carry out such an analysis.
One of their biggest problems was that they were getting too much data, from many different sources. Those included databases, spreadsheets, and regular files spread across various IT systems. In short – tons of valuable data and no good way to benefit from it.
And that’s where The Software House comes in!
Challenges – choosing the right path toward excellent business intelligence
Picking the right solution for the job is the foundation of success. In pretty much every project, there are a lot of core and additional requirements or limitations that devs need to take into consideration when making their decision. In this case, these requirements included:
- the ability to power up business Intelligence tools,
- a way to store large amounts of information,
- and the possibility to perform new types of analysis on historical data, no matter how old it was.
There are various data systems that can help us do that, in particular data lakes, data warehouses, and data lakehouses. Before we get any further, let’s brush up on theory.
Data lake vs data warehouse vs data lakehouse
A data lake stores all of the structured and raw data, whereas a data warehouse contains processed data optimized for some specific use cases.
It follows that in a data lake the purpose of the data is yet to be determined while in a data warehouse it is already known beforehand.
As a result, data in a data lake is highly accessible and easier to update compared to a data warehouse in which making changes comes at a higher price.
There is also a third option, a hybrid between a data lake and a data warehouse often referred to as a data lakehouse. It attempts to mix the best parts of the two approaches. Namely, It allows for loading a subset of data from the data lake into the data warehouse on demand. However, due to the complexity of data in some organizations, implementing it in practice may be very costly.
ETL or ELT?
One of the major concerns while working on such data systems is how to implement the data pipeline. Most of us probably heard about the ETL (“extract, transform, load”) pipelines, where data is extracted from some data sources at the beginning, then transformed into something more useful, and finally loaded into the destination.
This is a perfect solution when we know exactly what to do with the data beforehand. While this works for such cases, it does not scale well if we want to be able to do new types of analysis on historical data.
The reason for that is simple – during data transformation, we lose a portion of the initial information because we do not know at that point whether it is going to be useful in the future. In the end, even if we do have a brilliant idea for a new analysis, it might be already too late.
Here comes the remedy – ELT (“extract, load, transform”) pipelines. The obvious difference is that the data loading phase is just before the transformation phase. It means that we initially store that data in a raw, untransformed form and finally transform it into something useful depending on the target that is going to use it.
If we choose to add new types of destinations in the future, we can still transform data according to our needs due to the fact that we still have the data in its initial form.
ETL processes are used by the data warehouses, while data lakes use ELT, making the latter a more flexible choice for the purposes of business intelligence.
The solution of choice – data lake on AWS
Taking into account our striving for in-depth analysis and flexibility, we narrowed our choice down to a data lake.
Data lake opens up new possibilities for implementing machine learning-based solutions operating on raw data for issues such as anomaly detection. It can help data scientists in their day-to-day job. Their pursuit of new correlations between data coming from different sources wouldn’t be possible otherwise.
This is especially important for companies from the fintech industry, where every piece of information is urgently crucial. But there are many more industries that could benefit from having that ability, such as the healthcare industry or online events industry just to name a few.
A look at the data lake on AWS architecture
Let’s break the data lake architecture down into smaller pieces. On one side, we’ve got various data sources. On the other side, there are various BI tools that make use of the data stored in the center – the data lake.
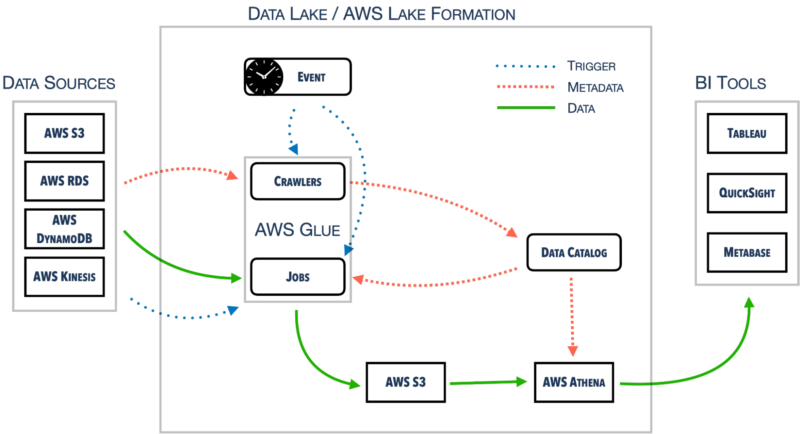
AWS Lake Formation manages the whole configuration regarding permissions management, data locations, etc. It is operating on the Data Catalog that is shared across other services as well within one AWS account.
One such service is AWS Glue, responsible for crawling data sources and building up the Data Catalog. AWS Glue Jobs uses the information to move data around to the S3 and, once again, update the Data Catalog.
Last but not least, there is AWS Athena. It queries S3 directly. In order to do that, it requires proper metadata from a Data Catalog. We can connect AWS Athena to some external BI tools, such as Tableau, QuickSight, or Metabase with the use of official or community-based connectors or drivers. AWS Athena has several use cases relevant in setting up observability processes in your organization. I’m going to go back to this topic later, because data observability is one of the foundations of Business Intelligence in a data driven company.
There are more exciting cloud implementations waiting to be discovered – like this one in which we reduced our client’s cloud bill from 30,000$ to 2,000$ a month.
🗳 How many points did you get?
You probably discovered some improvement areas. Mastering observability can be hard unless you rely on the support of an AWS Advanced Partner that has already solved the cloud challenges your organization faces.
Implementing data lake on AWS
The example architecture includes a variety of AWS services. That also happens to be the infrastructure provider of choice for our client.
Let’s start the implementation by reviewing the options made available to the client by AWS.
Data lake and AWS – services overview
The client’s whole infrastructure was in the cloud, so building an on-premise solution was not an option, even though this is still something theoretically possible to do.
At that point using serverless services was the best choice because that gave us a way to create a proof of concept much quicker by shifting the responsibility for the infrastructure onto AWS.
Another great benefit of that was the fact that we only needed to pay for the actual usage of the services, highly reducing the initial cost.
The number of services offered by AWS is overwhelming. Let’s make it easier by reducing them to three categories only: storage, analytics, and computing.
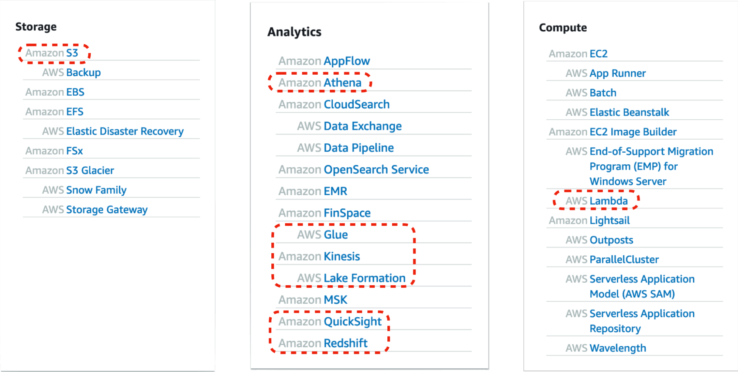
Let’s review those we at the very least considered incorporating into our solution.
Amazon S3
This is the heart of a data lake, a place where all of our data, transformed and untransformed, is located in. With practically unlimited space and high durability (99.999999999% for objects over a given year), this choice is a no-brainer.
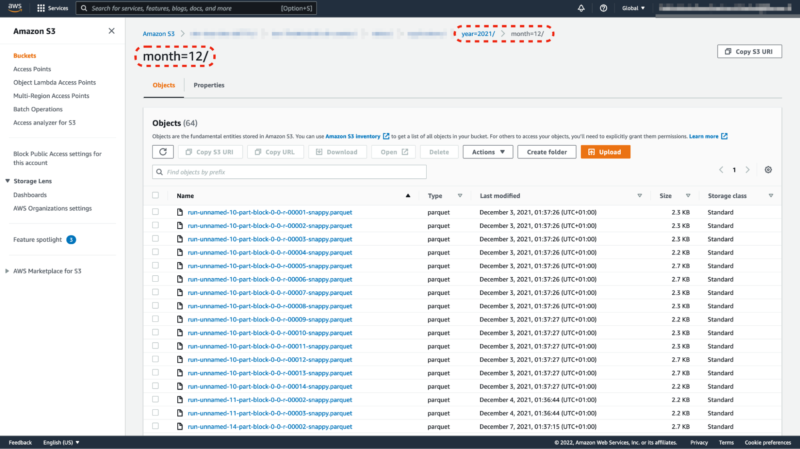
There is also one more important thing that makes it quite performant in the overall solution, which is the scalability of read and write operations. We can organize each object in Amazon S3 using prefixes. They work as directories in file systems. Each prefix provides 3500 write and 5500 read operations per second and there is no limit to the number of prefixes that we can use. That really makes the difference once we properly partition our data.
Amazon Athena
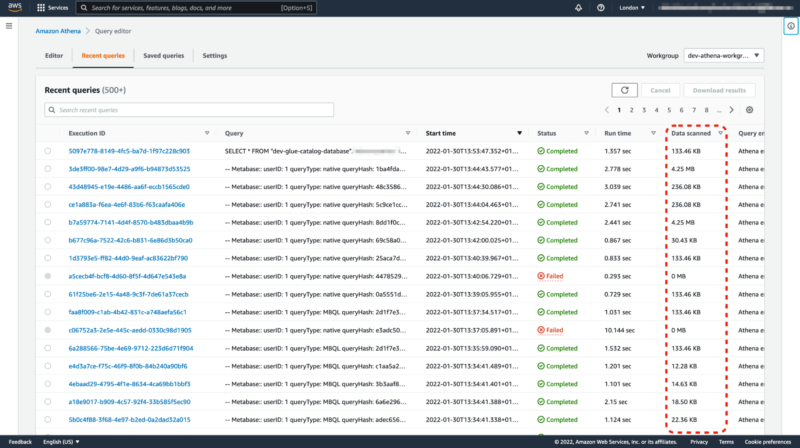
We can use the service for running queries directly against the data stored in S3. Once data is cataloged, we can run SQL queries and we only pay for the volume of scanned data, around 5$ per 1TB. Using Apache Parquet column-oriented data file format is one of the best ways of optimizing the overall cost of data scanning.
Unfortunately, Amazon Athena is not a great tool for visualizing results. It has a rather simple UI for experimentation but it’s not robust enough to make serious analysis. Plugging in some kind of external tool is pretty much obligatory.
Amazon Athena & observability
You can’t have strong BI in a complex system without setting up observability processes first – you need to know exactly what data you have. While this case study doesn’t focus on observability, it’s worth it to show just how much potential AWS services such as Athena and Glue have in that area.
When it comes to data lakes and observability, it is crucial to understand the health of your data. It means that you should make use of logs produced by all the ETL processes running on AWS Glue. You can store these logs in the same place as the rest of the data-lake data, which in this case is Amazon S3. Thanks to Amazon Athena’s capabilities of querying S3 data directly, you can perform a really quick analysis to verify if all the metrics are powered using correct and up-to-date data. Such results can be later sent to your BI tools such as Tableau.
When used alongside a columnar compressed storage file format such as Apache Parquet, the cost of running an Athena query in a data lake may be up to 99,7%(!) lower compared to using standard formats (e.g. CSV). This is a great way of reducing querying costs for AWS services – search for cloud cost optimization opportunities wherever they arise.
AWS Lake Formation
The goal of this service is to make it easier to maintain the data lake. It aggregates functionalities from other analytics services and adds some more on top of them, including fine-grained permissions management, data location configuration, administration of metadata, and so on.
We could certainly create a data lake without AWS Lake Formation but it would be much more troublesome.
AWS Glue
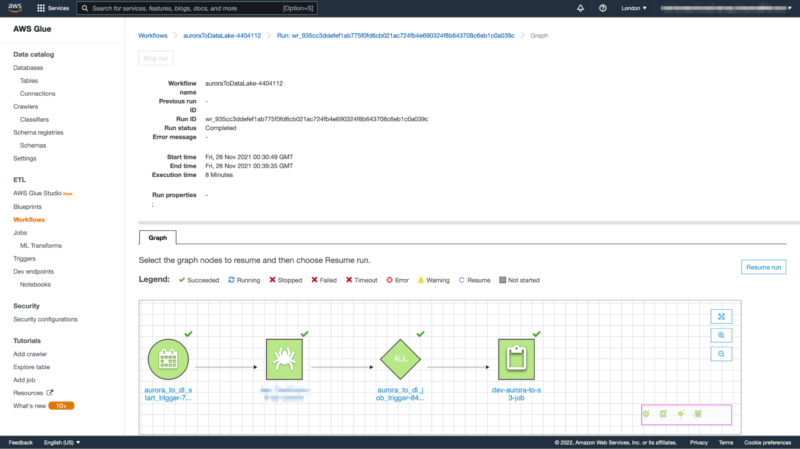
We can engineer ETL and ELT processes using AWS Glue. It’s responsible for a great range of operations such as:
- data discovery,
- maintaining metadata,
- extractions,
- transformations,
- loading.
AWS Glue offers a lot of ready-made solutions, including:
- connectors,
- crawlers,
- jobs,
- triggers,
- workflows,
- blueprints.
We might need to script some of them. We can do it manually or with the use of visual code generators in Glue Studio.
Business intelligence tools
AWS has one BI tool to offer, which is Amazon QuickSight. There are a lot of alternatives on the market, such as Tableau or Metabase. The latter is an interesting option because we can use it as either a paid cloud service or on-premise with no additional licensing cost. The only cost comes with having to host it on our own. After all, it requires an AWS RDS database to run as well as some Docker containers running a service such as AWS Fargate.
Amazon Redshift
Amazon Redshift is a great choice for hybrid solutions, including data warehouses. It is worth it to mention that Amazon Redshift Spectrum can query data directly from Amazon S3 just like Amazon Athena. This approach requires setting up an Amazon Redshift cluster first, which might be an additional cost to consider and evaluate.
AWS Lambda
Last but not least, some data pipelines can utilize AWS Lambda as a compute unit that moves or transforms data. Together with AWS Step Functions, it makes it easy to create scalable solutions equipped with functions that are well organized into workflows.
As a side note – are Amazon Athena and AWS Glue a cure-all?
Some devs seem to believe that when it comes to data analysis, Amazon Athena or AWS Glue are nearly as all-powerful as the goddess that inspired the former’s name. The truth is that these services are not reinventing the wheel. In fact, Amazon Athena uses Apache Presto and AWS Glue has Apache Spark under the hood.
What makes them special is that AWS serves them in a serverless model, allowing us to focus on business requirements rather than the infrastructure. Not to mention, having no infrastructure to maintain goes a long way toward reducing costs.
We proved our AWS proves developing a highly customized implementation of Amazon Chime for one of our clients. Here’s the Amazon Chime case study.
Example implementation – moving data from AWS RDS to S3
For various reasons, it would be next to impossible to thoroughly present all of the elements of the data lake implementation for this client. Instead, let’s go over a portion of it in order to understand how it behaves in practice.
Let’s take a closer look at the solution for moving data from AWS RDS to S3 by using AWS Glue. This is just one piece of the greater solution but shows some of the most interesting aspects of it.
First things first, we need properly provisioned infrastructure. To maintain such infrastructure, it is worth it to use some Infrastructure as Code tools, including Terraform or Pulumi. Let’s take a look at how we could set up an AWS Glue Job in Pulumi.
It may look overwhelming but this is just a bunch of configurations for the job. Besides some standard inputs such as a job name, we need to define a scripting language and an AWS Glue environment version.
In the arguments section, we can pass various information that we can use in a script to know where we should get data from and where to load it in the end. This is also a place to enable bookmarking mechanism, which highly reduces processing time by remembering what was processed in previous runs.
Last but not least, there is a configuration for the number and type of workers provisioned to do the job. The more workers we use, the faster results we can get due to parallelization. However, that comes with a higher cost.
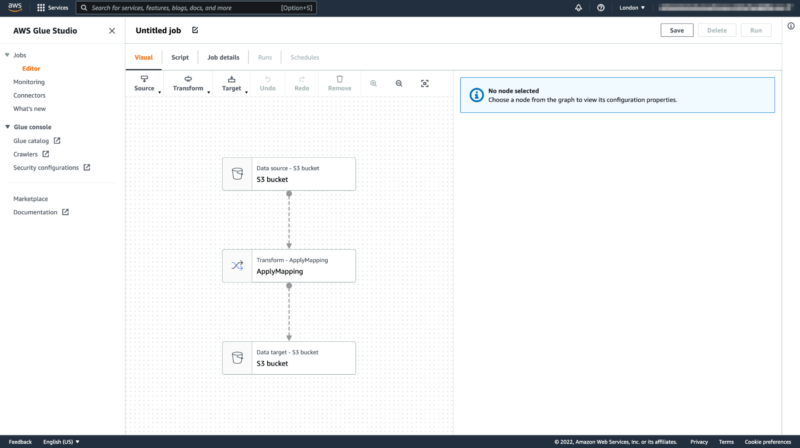
Once we have an AWS Glue job provisioned, we can finally start scripting it. One way to do it is just by using scripts auto-generated in AWS Glue Studio. Unfortunately, such scripts are quite limited in capabilities compared to manually written ones. On the other hand, the job visualization feature makes them quite readable. All in all, it might be useful for some less demanding tasks.
This task was much more demanding. We could not create it in AWS Glue Studio. Therefore, we decided to write custom scripts in Python. Scala is a good alternative too.
We start by initializing a job that makes use of Spark and Glue contexts. This once again reminds us of the real technology under the hood. At the end of the script, we commit what was set in a job and the real execution only starts then. As a matter of fact, we use the script for defining and scheduling that job first.
Next, we iterate over tables in a Data Catalog stored there previously by a crawler. For each of the desired tables, we compute where it should be stored later.
Once we have that information, we can create a Glue Dynamic Frame from a table in Data Catalog. Glue Dynamic Frame is a kind of abstraction that allows us to schedule various data transformations. This is also a place where we can set up job bookmarking details such as the column name that is going to be used for that purpose. The transformation context is also needed for bookmarking to make it work properly.
To be able to do additional data transformation, it is necessary to transform a Glue Dynamic Frame into Spark Data Frame. That opens up a possibility to enrich data with new columns. In this case, these would include years and months derived from our data source. We use them for data partitioning in S3, which gives a huge performance boost.
In the end, we define a so-called sink that writes the frame. Configuration consists of a path where data should be stored in a given format. There are a few options such as ORC or Parquet, but the most important thing is that these formats are column-oriented, and optimized for analytical processing. Another set of configurations allows us to create and update corresponding tables in the Data Catalog automatically. We also mark the columns used as partition keys.
The whole process runs against a database consisting of a couple of tens of gigabytes and takes only a few minutes. Once the data is properly cataloged, it becomes immediately available for use in the SQL queries in Amazon Athena, therefore in BI tools as well.
Deliverables – new data system and its implications
At the end of the day, our efforts in choosing, designing, and implementing a data lake-based architecture provided the client with a lot of benefits.
Business
- Data scientists could finally focus on exploring data in the company, instead of trying to obtain the data first. Based on our calculations, it improved the efficiency of data scientists at the company by 25 percent on average.
- That resulted in more discoveries on a daily basis and therefore more clever ideas on where to go as a company.
- The management of the company had access to real-time BI dashboards presenting the actual state of the company, so crucial in efficient decision-making. They no longer needed to wait quite some time to be able to see where they were.
Technical
As far as technical deliverables go, the tangible results of our work include:
- architecture design on AWS,
- infrastructure as code,
- data migration scripts,
- ready-made pipelines for data processing,
- visualization environment for data analytics.
But the client is not the only one that got a lot out of this project.
Do you also want to make better use of your company data?
Consider consulting and hiring seasoned data engineering experts from The Software House.
Don’t sink in the data lake on AWS – get seasoned software lifeguards
Implementing a data lake on an AWS-based architecture taught us a lot.
- When it comes to data systems, it is often a good idea to start small by implementing a single functionality with limited data sources. Once we set up the processes to run smoothly, we can extend them with new data sources. This approach saves time when the initial implementation proves flawed.
- In a project like this, in which there are a lot of uncertainties at the beginning, serverless really shines through. It allows us to prototype quickly without having to worry about infrastructure.
- Researching all the available and viable data engineering approaches, platforms and tools is crucial before we get to the actual development because once our data system is set up, it’s costly to go back. And every day of inefficient data analytics setup costs us in the business intelligence department.
In a world where trends are being changed so often, this research-heavy approach to development really places us a step ahead of the competition – just like properly setting up business intelligence itself.

