19 November 2021
Architecture testing for performance - how to guarantee a highly efficient system?


Architecture testing can be a daunting task – especially for devs who aren’t in the habit of testing architecture from the very beginning and continuing to do so as their deadline approaches. We’re here to tell you that it’s really worth the effort and save you a ton of time and tears in your next project!
When you’ve been working as a Quality Assurance Expert for a long time, you might get to thinking: “Ok, I’m good at it! I have the necessary skill set, I have a lot of experience, nothing can surprise me anymore.” And then you get asked to test architecture.
For a QA like myself who specializes in manual testing, it was like my worst nightmare come true. My first thought was that it is some kind of punishment for always trying to convince everyone that QA should be a part of every project from the very beginning.
Spoiler alert: now I am completely certain that it should be.
Despite my initial fear, I was able to conduct architecture tests, learn new skills and even have a bit of fun while doing it – with a little help from my colleague. Together with Bartek, our PHP developer who was also part of the team, we will tell you about the project that proved to be both a challenge and an architecture testing learning experience.
You will see both of our unique perspectives and also a conclusion that we came up with. I hope you enjoy it and will use our knowledge to make your own architecture testing adventure a more pleasant experience.

Why test the architecture? Here are 6 basic reasons:
First of all, let’s remember that good and thoughtful architecture is the very first step to creating great software. In a nutshell, architecture defines software components and dependencies between them. It characterizes the working environment and also gives a roadmap you need to follow to create and develop the software you want.
In most cases it focuses on the following aspects:
- System extensibility
- System flexibility
- System performance
- System reusability
- Readability and understandability of the code
- System testability
As you probably know, while creating an architecture concept you develop descriptions, UML diagrams, even prototypes, and use cases.
ALL those things can be tested. 🙂 There are many types of architecture tests – in this project, the essential one was performance testing.
What does architecture testing look like in practice?
The same as an application test! Based on the documentation you have (I mean all materials that were created during the “architecture phase”) you can create test cases in order to define both the initial and final conditions for the process.
If this proves impossible, then take it as your first red flag that the architecture is probably not as coherent as you want it to be. It’s safe to say that if you aren’t able to test the architecture, then you most likely won’t be able to test the solution when delivered. Test scenarios are usually very basic, however, they have the power to form a catalyst for discovering business issues and scenarios that weren’t covered by the architecture.
To be honest, I discovered that testing architecture isn’t all that different from other projects. But when I first got told that I was about to test a tool that will be used by programmers to configure other systems, I was worried that I wouldn’t be able to do it.
Read on and see what Bartek has prepared on the subject.
Let’s start with some basic information about the project
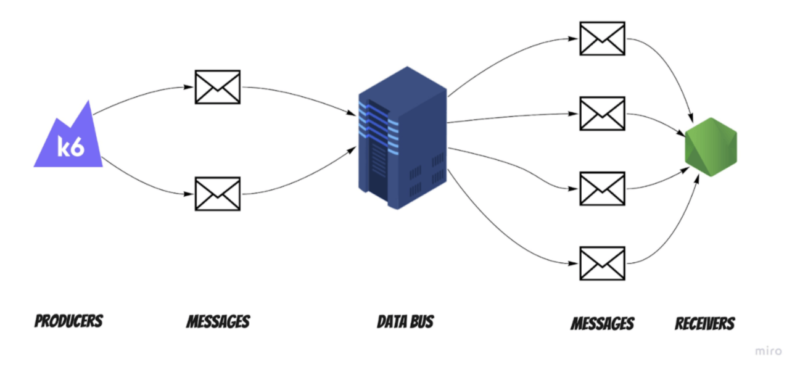
Before starting to talk about architecture tests, we should start with some basic information on how this system works. The client wanted to have a highly available and reliable data bus. The data bus’s main job is propagating messages between systems.
Producers can send the messages to the data bus without knowing who the receiver is. The data bus accepts them and propagates them to previously defined receivers based on settings and configuration. Take a look at the diagram below for a better perspective:
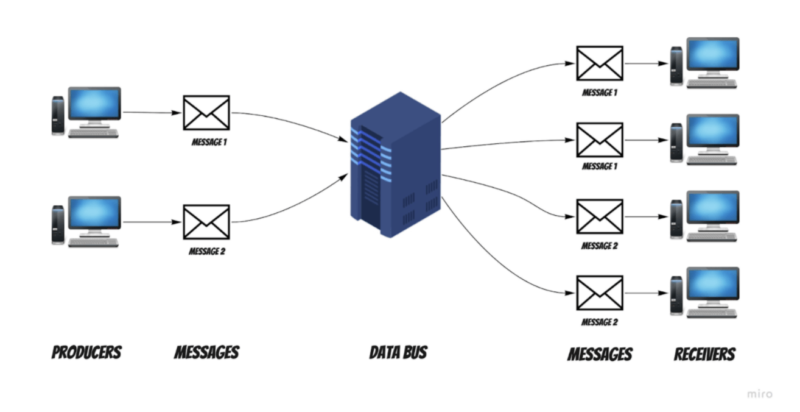
Of course, this is a simplified main flow. The whole system is more complicated – there are many secondary features dependent on the configuration or message structure of the data bus. However, the principal concept is enough to understand how we approached designing the solution and architecture testing.
Non-functional requirements
Before the launch of the data bus implementation, the client has defined the most important non-functional requirements. They had a deep impact on the proposed solution we came up with.
- The first requirement was that we needed to write the whole project using the Symfony framework and PHP. The main reason behind this was that the client had the most experience with these specific tools. It is easier to maintain projects made with technologies we already know – this is something we always try to keep in mind.
- The second requirement was strictly related to the data bus performance. It needed to accept no less than 1000 messages per second for 20 minutes – that’s at least 1,200,000 messages! We also received the specifications of the server on which the project would ultimately be launched. That requirement is what we decided to focus the most on in the beginning.
What’s more, cloud solutions were out of the question. The client insisted on simple solutions. The data bus had to be easily deployed on any Linux-based server.
First step – proof of concept!
We started the project by implementing the data bus’s core use case – receiving messages. We didn’t bother with error handling or data bus configuration. Our only target was to check whether the efficiency target was achievable on the specific machine. So we spent the first few weeks delivering the so-called proof of concept.
At the outset, we selected a few supplementary technologies we would use for the project. We chose a relational database for storing messages. The main reason for that was the durability of the data. We couldn’t afford to lose any message.
A NoSQL approach, which is considered to be faster on single write and read operations – cannot ensure that. These databases store data in a RAM buffer first, and periodically write it to disk. In the event of a power outage, we could not guarantee that an already received message was stored, and therefore, PostgreSQL was our first choice.
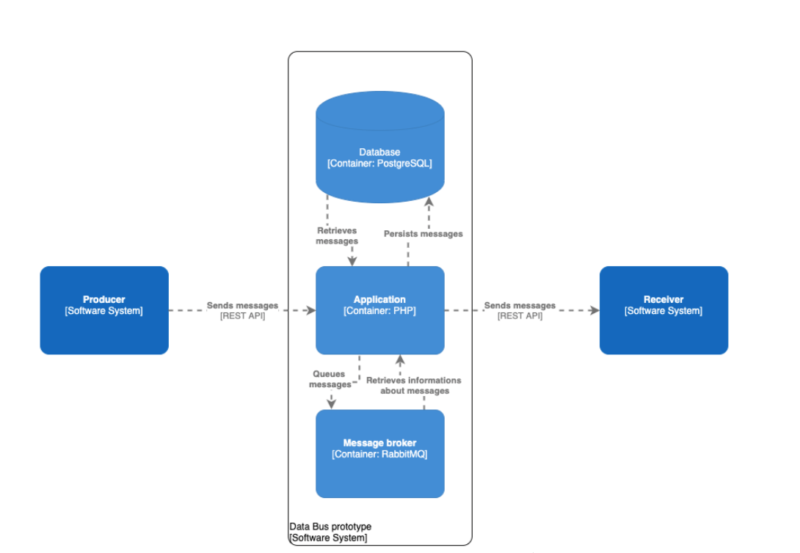
Producers and the data bus communicate via REST API. As we mentioned before, the data bus must accept many messages per second. Therefore, we had to ensure the fastest possible handling of the request and the message persistence. The rest of the job – propagating messages to the receivers – can be done asynchronously. Our best bet was RabbitMQ. After persisting messages, the system publishes information about it to the message broker.
🎦 Learn cloud best practices from 2 CTOs
Watch an event that sets expectations vs reality of cloud use.
You’ll learn to choose the right cloud services and when to optimize architecture to maximize results
Hosted by two veterans — our CTO Marek Gajda and Michał Smoliński, CTO of Radpoint, who built cloud-powered products able to service millions of customers.
April 12th, at 3:00PM CET
Free to join
Proof of concept completed – time for some architecture tests
With the first version of our data bus finished, it’s time to think about testing it. After all, that’s why we created it!
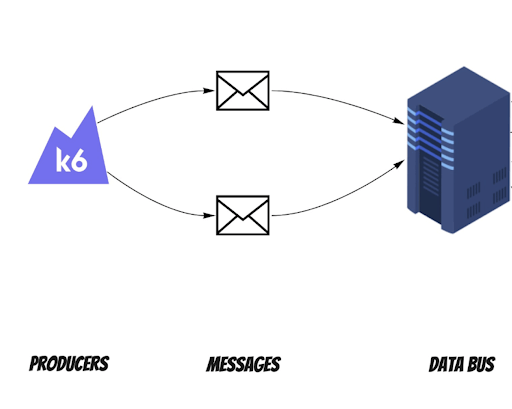
We were wondering how we could model a lot of producers sending messages. Our head of QA came to the rescue and showed us the K6 tool and its possibilities. If you want to learn more about it, he wrote a comprehensive K6 framework article.
In short, it allows you to write a simple script in JavaScript to create virtual users who make HTTP requests for modeling purposes. And this is exactly what we were looking for.
We performed a few types of performance tests:
- Endurance testing – that was our main focus. You can perform endurance testing when testing the application behavior with an expected load for a long period of time.
- Stress testing – this is used for checking the critical breaking points of our application. It provides the answer to how big the load can be until our system stops working effectively.
- Load testing – for verifying the bottlenecks in our architecture and application. The architecture components of our systems are monitored when we perform load testing.
At first, we wanted to investigate the maximum load the data bus can accept. So we wrote a simple K6 script that selects a random message from the prepared pool and sends it to the data bus. It is also worth mentioning that our first tests were performed on a machine more or less four times worse than the target environment.
You may ask, why? I think improving your architecture on a weaker machine can be a profitable approach. It helps you find more things that are reducing the performance as you have fewer computing resources.
First outcome
Our first results weren’t satisfactory. We achieved the outcome of ±450 requests per second. As it wasn’t so bad (for a weaker machine), another stat worried us. It turned out that around 5% of requests ended with internal server errors. The culprit turned out to be server resources. We needed to reduce the test load to find a critical point without internal server errors. And so we did. That point was near ±280 requests per second. It was almost four times less than the required minimum load!
I know what you’re thinking right now. “You have a four times slower machine and four times less required minimum load. So after you move the solution to the target environment – the results will be above 1000 requests per second!”. Unfortunately, it’s not that simple: performance does not increase linearly with increasing computing resources.
We began to look for an explanation for this performance problem on many levels. After some research, we had a few suspects. We started to check them one by one. This was an essential process necessary to rule out false assumptions.
Suspect number one – an application code
We proceed to check our code. The average request time during first load testing was 170 ms. That’s quite a lot for an endpoint that is just accepting the message and persisting it.
We started to analyze a single request using the Xdebug profiler. After that, we visualized the results using PHPStorm. These two combined can be a powerful tool for profiling requests in addition to interactive debugging. You can check how to do it here. In short – you can explore the execution paths of all called functions in the request and see how much time every step took.
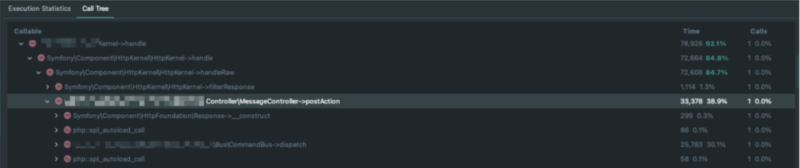
On this basis, we came to some interesting conclusions and found the causes of a slower request:
- Symfony Messenger – it’s a powerful tool that uses buses to send messages and handle them. However, we initially used it in the data bus only for a clean CQRS approach. It turned out that executing a command via handler has a big call tree which takes a significant time in our request. We removed it and started to invoke handlers in a service call way.
- SensioFrameworkExtraBundle – in our case, we used it for the ParamConverter feature – to convert the raw request into some object. We didn’t foresee that this package was using its listeners on all controller actions. XDebug Profiler Snapshot showed that we didn’t need almost any of them, except for the one related to ParamConverter. Removing this package and replacing it with our custom converter boosted our requests execution time.
- JMS Serializer – used for (de)serializing data. It supports XML and JSON formats. During our tests, we found it to be a little bit slower than the Symfony one. It was also much clearer to write custom normalizers for the second one (we had to because of the complex message structure).
Writing custom solutions for command handling, converting requests, and (de)serializing data worked well. We reduced the prototype’s request execution time by over 80%! After executing performance tests again, our average request time was around 30 ms. We did stress tests again to find a maximum load the data bus can accept without internal server errors. And it increased to ±450 requests per second. The result was around 60% better than before code changes!
As you can see, there are some situations when it’s worth replacing popular and helpful tools with custom stuff. In most cases, you won’t notice any difference. However, it really does matter when it’s about the performance during a load of a high amount of requests.
Suspect number two – connections between components
Our next suspect was related to the database and message broker operations. We wanted to check if these were causing performance issues. To do this, we chose a system monitoring tool called Prometheus. We started to gather times of database operations and message publishings in our application during the load testing. We also created an API endpoint for fetching these times. Then, we integrated it with Grafana to view the results on an ongoing basis.
During load testing with Grafana, the “requests per second” metrics were much worse, but we expected this. It was due to collecting additional data by Prometheus. This didn’t bother us, because we just wanted to check the average operations time of components which the data bus was using.
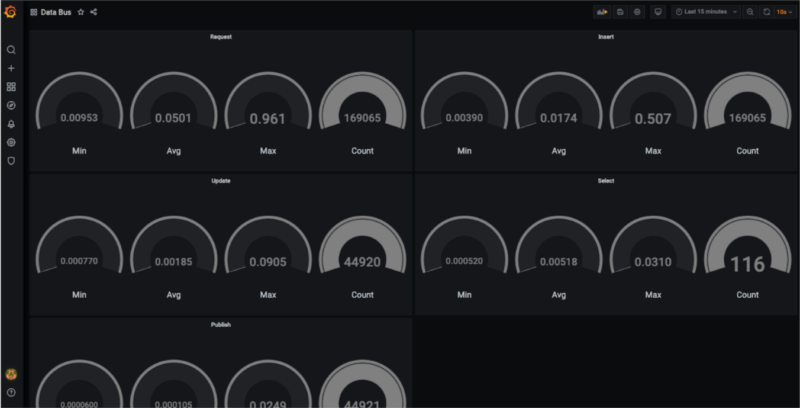
As you can see on the dashboard above – the connection between components was not the issue. We removed it from the list of suspects.
Incidentally, if you want to learn more about Prometheus and collecting metrics, check out this article about Grafana and Prometheus metrics testing written by my colleagues.
Suspect number three – system components
After code improvements and checking the connection times between components, it was time to monitor server resources. We suspected that under heavy load, the PHP application might be competing with other system components for server resources. It’s worth adding that another requirement regarding the application, apart from working on a dedicated machine, was to containerize the data bus and its other components. We used Docker for that.
We gathered the resource usage statistics with a custom script using a Docker stats command. It would save the results every 15 seconds to a file. After that, we transformed the data and created separate line graphs for RAM and CPU usage.
We found nothing of interest in the RAM graph. However, the second CPU usage diagram caught our attention. Remember that in the Docker monitoring tool, one CPU thread’s maximum utility is 100%. That’s why the data have values above 100% on the graph below.
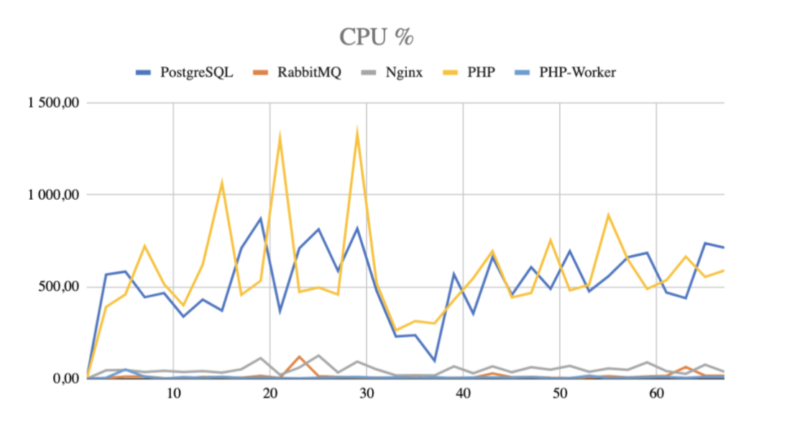
Bingo! It looked like we were right because PHP fought for resources with the database.
Our first approach was to start tweaking the database. We researched what should be the best settings for the highest performance. Unfortunately, a few tries of database configuration changes did not bring the expected results. Maybe it would have worked on other machines – but in our dockerized environment, it wasn’t helping.
We tried a NoSQL solution and used MongoDB (at that time we did not know that it was not an option). And the results were much better than with relational databases. We achieved a result of ±1400 requests per second! However, after the first tests, we abandoned this solution. It was due to the requirement of data durability from the client.
We decided to try a different relation database engine – we thought that maybe the resource utility would change compared to PostgreSQL. We bet on MariaDB and started to search for the critical point of our application.
Our first results with a replaced database engine were a big shock to us. The maximum load the data bus can handle increased from ±450 requests per second to stable ±700 requests per second! And that was on almost default database configuration. We just have increased the allowed number of concurrent connections.
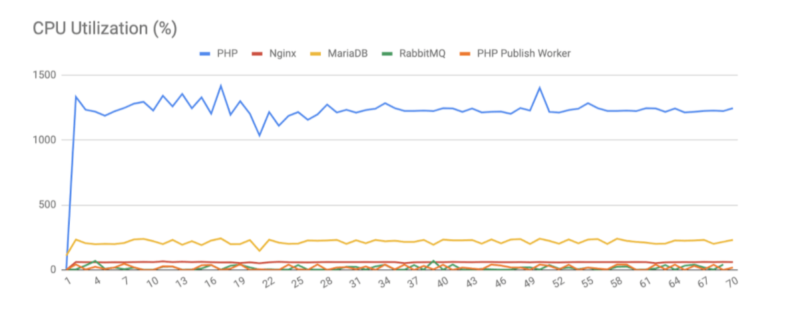
We run our load tests and monitoring tool to check resources utility with a new database engine. It turned out that MariaDB uses less CPU and is more greedy for RAM. It was not a problem as we had a lot of spare RAM in our environments. We tried to manipulate the MariaDB config hoping for even better performance, but that didn’t work for our case.
Time for moving the solution to the target environment.
After improving our application’s performance, we moved to the dedicated test environment and executed tests. And we almost got a heart attack. Around 50% of requests ended with failure! We started to look for a cause of it. It took us a while, but we found it.
The problem was with the kernel parameters in the PHP docker container. The port range was too small, and there were not enough allowed maximum parallel connections. We added a sysctls section in our docker-compose file and executed tests again.
The results were very satisfactory. We got stable ~1500 requests per second in a 20-minutes endurance test load, which is 50% above the required minimum! Improving the application’s performance on a much weaker machine paid off.
In the next steps, we developed the application with new features. We also added sending messages from the data bus to our test architecture. We deployed a simple application in Node.js, which was imitating the receivers accepting messages. We ran our performance tests after every feature, which could affect the performance of the application. In the end, after developing all of the core features, our performance slowed a little bit to ±1430 requests per second. That result was also satisfactory.
Conclusions
We achieved our goal and met the performance requirement specified by the client. As you can see, there are many ways to improve the performance of your application:
- Use profiler for searching for any bottlenecks of your application.
- Verify the libraries/packages you have in your project. Make sure you need all of them.
- Check the architecture and components you use. Maybe there are more efficient substitutes.
- Test connections between the components of your application.
- Run performance tests regularly. Sometimes, an inconspicuous change in your code could have a massive impact on performance.
The problem can be at the code level, the connection level, and even mismatched application components. Remember to choose the right tools for the problem. And that there are many ways and supporting tools to test the performance too.
Final words: What has this project taught us?
First of all, very close cooperation between the development team and QA. We both had a chance to get to know more about our work perspective. I became convinced that a QA that specializes in manual tests is the perfect person to test architecture because they have a very different approach than programmers, but it requires patience and openness on both sides (programmer and tester). Thanks to the architecture tests, QA Specialists can find potential bugs and gaps before even the first line of code appears.
Working with a prototype was something new for both of us but I think we agree that it is very convenient to have time and space to check if ideas work as we expect in an isolated environment, before we create millions of lines of code.
Performance might be very tricky, and it is good to check it once in a while even if the client does not require it directly – it will save you time in the long run, and you won’t have any terrible surprises at the end of the project.
Thanks to excellent team cooperation (remember developers and testers are always playing for the same team) we were able to meet customer requirements yet again!
Bonus round: a recap of tools we used for architecture testing
K6 – load testing tool
Xdebug profiler – tool for finding bottlenecks in your script
Grafana – Operational dashboard
Docker – Containerization platform
Prometheus – an open-source monitoring tool

